swift
How fast is swift? Heavy Metal Edition (feat Nardi)
The challenge, confirm a friends belief that swift is real system language by simulating buckets of particles, at least 100m on the cpu, hopefully beating out rust.
Let's go.
we've been here before
About a year ago I simulated millions of particles in everyone's favorite language, javascript, all on the cpu. It even worked on mobiles! Disgusting I know.
And then, to see just how slow javascript really is, I simulated even MOAR particles in rust. Way more. But not on mobile because rust doesn't like mobile. Really Apple and Google don't like mobile but that is beside the point.
After the rust job, Nardi, the local Apple cult member in my life, suggested it would be interesting to see what swift could do because it is real system language now. I looked at the swift simd spec and got excited but the timing wasn't right.
However,
It is time,
to get Swhfity.

A digression to the left
Just like with the rust version, it will be hard to give you interactive examples to experience first hand. I will include all the source code (very messy), images, and videos but for this kind of project, compression really doesn't do it justice. The richness of colour and sharpness is absolutely crushed by compression.
Once again, the web is king of distribution. It is so easy. But alas, we are real engineers now so you will need to compile the source code yourself to try it out
And we are also real rich engineers so you will need Apple drip to compile the code because Apple really doesn't like poor people. Trust me. I asked Tim Apple himself. He said I was too poor to talk to him but not too poor to fork over $100/year in Apple dev licensing fees so I can sign my builds. Excuse me, $99/year plus tax.
Thanks Tim, keep it up.
The First Pass
To keep things somewhat of an apples-to-apples comparison the simulation will remain largely unchanged from the js /rust land versions. Though, I do want to take advantage of every bit of special swift sauce there is just like I tried to do in rust.
The brief rundown here is that particles have an x, y, dx, and dy. Then when you tap and swipe around they will be pulled towards a point in space all gravity like. I want to stick with cpu as much as possible and be blazingly fast.
As we all know, blazingly fast means linear arrays of tightly packed data with maximum cache coherency. This is true for js, rust, and certainly swifty boy too. Speaking of swift.
The last time I touched swift and xcode was over a decade ago. Xcode still seems a requirement these days so after waiting a few hours for xcode to install and update I spun up a brand new app. I picked the default template and started asking gypity questions about the sample code.
Apple loves OOP. I do not love OOP.
I will avoid giving a tutorial on swift ui because I think it makes the swift language look far uglier than it is although swift's “sugar” often leaves me scratching my head.
I start out with the simple, the pure, the beautiful; particle.
struct Particle {
  var x: Float32;
  var y: Float32;
  var dx: Float32;
  var dy: Float32;
}
Lovely.
Then we get to the ugly. I will skip over the pain. First version crashed, second hung forever, third did the same, and then I figured out what was happening. I was trying to create an image which had pixels I could manually update. What I didn't know is that swift ui's CGImage is immutable. That's right kids swift ui took a hint from react both in style and design embracing the immutable. Gross. Well only gross if you want to be fast.
Updating a pixel value creates a copy of the entire image and whatever swifts memory magic is was having a very hard time of it. I found that swift ui has an object called CGContext which is basically a js canvas object. I did some fillRects which worked broke down past 10k particles. This is expected.
But it works!
I found you can pass in a backing pixel buffer directly to CGContext and any updates to the backing buffer are reflected to the cg bitmap context object thingy. Money.
final class ParticleSimulation: ObservableObject {
  // variables

  init(width: Int, height: Int) {
    self.width = width
    self.height = height
    self.pixelData = []
    self.particles = []

    self.resize(width: width, height: height)
    self.generateParticles(count: self.particleCount)
    self.image = bitmapContext?.makeImage()

    startFrameLoop()
  }

  // more code
}
I am in OOP land so init is like a constructor which is called from a view which has a different controller delegate, depending on if it is iOS or OSX, that then sends event updates to the particle sim object which is an Observable with a bound CGImage that gets updated when a render loop, again, based on iOS or OSX, triggers a change which signals back up to the view that it needs to render because the observed CGImage signaled a change. Did you follow all that? I know I didn't.
Resizing is important because SwiftUI in osx for some reason triggers a few resize events on start which makes sizing a little weird to manage. But I am sure one could say this is just skill issues.
This is the part that really matters. This code is run on a resize and on start.
self.pixelData = [UInt8](repeating: 0, count: width * height * 4)
let bitsPerComponent = 8
let bytesPerRow = width * 4
let colorSpace = CGColorSpaceCreateDeviceRGB()
let bitmapInfo = CGBitmapInfo(rawValue: CGImageAlphaInfo.premultipliedLast.rawValue | CGBitmapInfo.byteOrder32Big.rawValue)
self.bitmapContext = CGContext(data: &pixelData,
                               width: width,
                               height: height,
                               bitsPerComponent: bitsPerComponent,
                               bytesPerRow: bytesPerRow,
                               space: colorSpace,
                               bitmapInfo: bitmapInfo.rawValue)
It creates a bitmap backed by a pixel buffer I can update all unsafe like. Unsafe is important because multi-threading will happen in the future.
private func step() {
  tick()
  render()
  self.image = bitmapContext?.makeImage()
}
That is the step function triggered by a timer with a very familiar tick and render if you remember the js/rust versions.
func tick() {
  for i in particles.indices {
    var p = particles[i]

    // pull physics if input pressed

    p.x += p.dx
    p.y += p.dy
    p.dx *= 0.99
    p.dy *= 0.99

    // bounds check

    particles[i] = p
  }
}

func render() {
  pixelData.withUnsafeMutableBytes { bufferPtr in
    guard let ptr = bufferPtr.baseAddress?.assumingMemoryBound(to: UInt8.self) else { return }
    ptr.initialize(repeating: 0, count: width * height * 4)
  }

  for p in particles {
    let xi = Int(p.x)
    let yi = Int(p.y)

    if xi >= 0 && xi < width && yi >= 0 && yi < height {
      // get rgb
      let index = (yi * width + xi) * 4

      pixelData.withUnsafeMutableBytes { bufferPtr in
          guard let ptr = bufferPtr.baseAddress?.assumingMemoryBound(to: UInt8.self) else { return }
          ptr[index] = r
          ptr[index + 1] = g
          ptr[index + 2] = b
          ptr[index + 3] = a
      }
    }
  }
}
Now, the assuming memory bound and withUnsafe bits, I know why they exist but they are ugly to me. I am no systems language expert but I just want a pointer to some memory I can go ham with. Rust has a similar syntax with trying to keep people from segfaults but come on, let a brother segfault if they want to. I promise I know what I am doing.
This is fine for a first pass because it will handle 1 million particles.
2 million as you can tell...makes it not happy.
The astute observer will notice that I have been using a bit ye'olde gypity to help me out. And even then, progress has been slow. Swift doesn't seem too bad but swiftui and the OOP style have been tripping me up. Skill issues I am sure.
Time for some heavy metal.
The Second Pass
I did a little profiling and found that the SwiftUI bit keeps triggering a reflow much like css does in swift ui's layout system and this is pretty slow even though it does almost nothing. I need to get...
low level
Some would say, bare metal.
Yup, so again, OOP style there is a metal view which massively simplifies the state syncing but at the cost of requiring a shader to get anything on the screen. I know I know but the js version did end up doing a pass through shader so I think it is fair to use a whispering of gpu code as long as the pixel updates and sim stay on the cpu.
I am not ashamed to say gypity helped me out in wrangling the metal api code. Fire me. I don't care. I only have so many hours in the day for this stuff and if I am honest with myself, I doubt I will touch Metal again for at least a decade after all this.
Gypity G had the texture getting updated via a region api call. I changed it to use a metal buffer for pixel data. This is because Apple cpu's have shared memory with the gpu and you can set the mode for the buffer to be shared which should bypass a useless copy and drop a duplicate buffer. It did nothing for performance but it made me feel better.
The important part of moving to metal for rendering is this
class MetalRenderer: NSObject, MTKViewDelegate {
  let device: MTLDevice
  let commandQueue: MTLCommandQueue
  var texture: MTLTexture?
  var pixelBuffer: MTLBuffer?

  // lots of other code

  func setupRenderPipeline(view: MTKView) {
    // buckets of arcane metal api and inline shader strings
  }

	func createTextureAndBuffer(width: Int, height: Int) {
    self.width = width
    self.height = height

    // metal requires alignemnt to 16 bits for texture buffs...lame
    let bytesPerPixel = 4
    let alignment = 16
    var rowBytes = width * bytesPerPixel
    rowBytes = (rowBytes + alignment - 1) & ~(alignment - 1)
    var length = height * rowBytes
    length = (length + alignment - 1) & ~(alignment - 1)
    // yes it does cause visual chaos if width is not divisable by 16
    // but it doesn't crash...

    pixelBuffer = device.makeBuffer(length: length, options: [.storageModeShared])

    let textureDescriptor = MTLTextureDescriptor.texture2DDescriptor(
        pixelFormat: .rgba8Unorm,
        width: width,
        height: height,
        mipmapped: false
    )
    textureDescriptor.usage = [.shaderRead, .renderTarget]
    textureDescriptor.storageMode = .shared
    self.texture = pixelBuffer?.makeTexture(descriptor: textureDescriptor, offset: 0, bytesPerRow: rowBytes)
  }
}
Just like with the swiftui version, there is a buffer that can be written into which backs a texture on the gpu. Then via arcane metal api calls, we can blit the texture to the screen using a pass through shader and a quad.
func draw(in view: MTKView) {
  let currentTime = CFAbsoluteTimeGetCurrent()
  let deltaTime = currentTime - lastFrameTime
  lastFrameTime = currentTime

  tick(dt: Float(deltaTime))
  render()

  // metal render
}
What makes this metal view nice is there is a single draw function which will automatically sync to the refresh rate. I also added in delta time to smooth things out a bit.
I looked at the metal code and it really isn't that different from opengl. The command buffer stuff is pretty nice as it moves some setup out of the render but gpu api code is very...long and I will not pretend I am an expert at best I am but a neophyte.
The tick and update are almost the exact same but it now scales based on the delta time.
Much smoother at lower frame times. Here is a video showing that resizing still works although with some cool looking quirks. Not crashing, makes this a victory.
Moving to metal did little for performance. Multi threading will help but best to check the profiler.
Apple's profiler is pretty rad. This is a tree view much like chrome's javascript profiler. This was before I moved to the metal setup. You can see the time spent in each function.
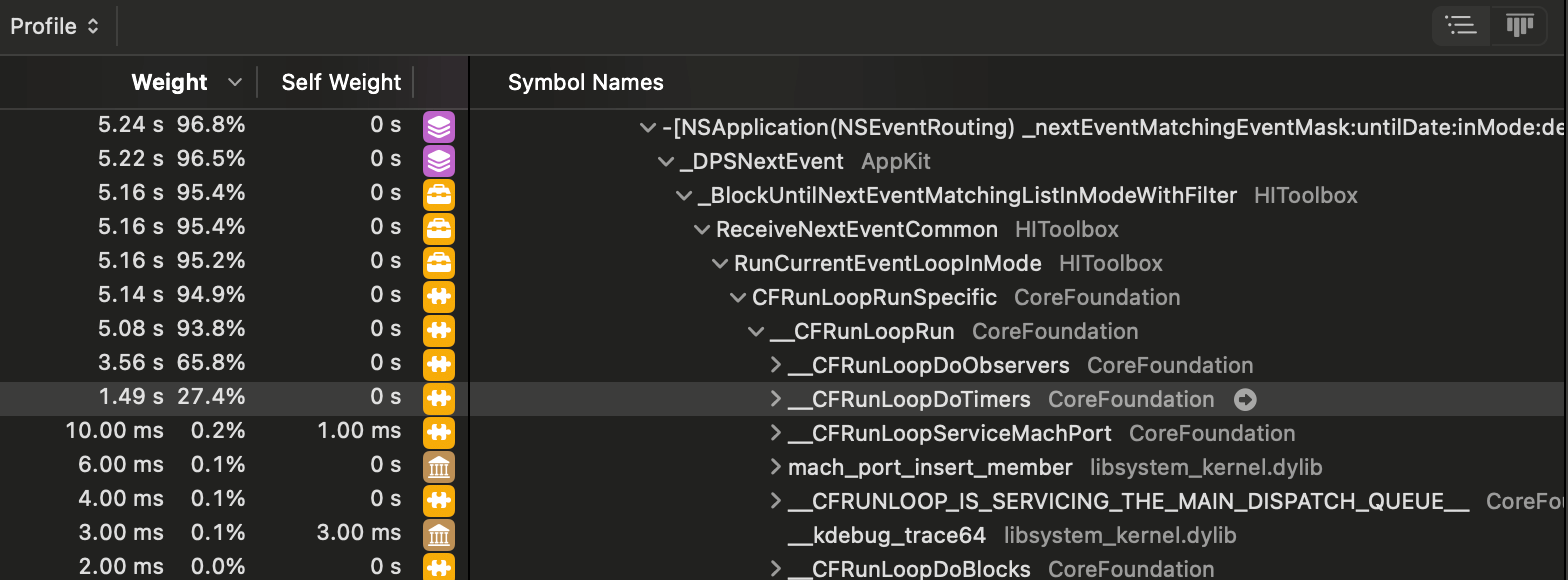
What is particularly nice is you can right click and inspect the source of any function. This is the view of this new metal versions render function where the particles are drawn as pixels. And it is what I'd expect.
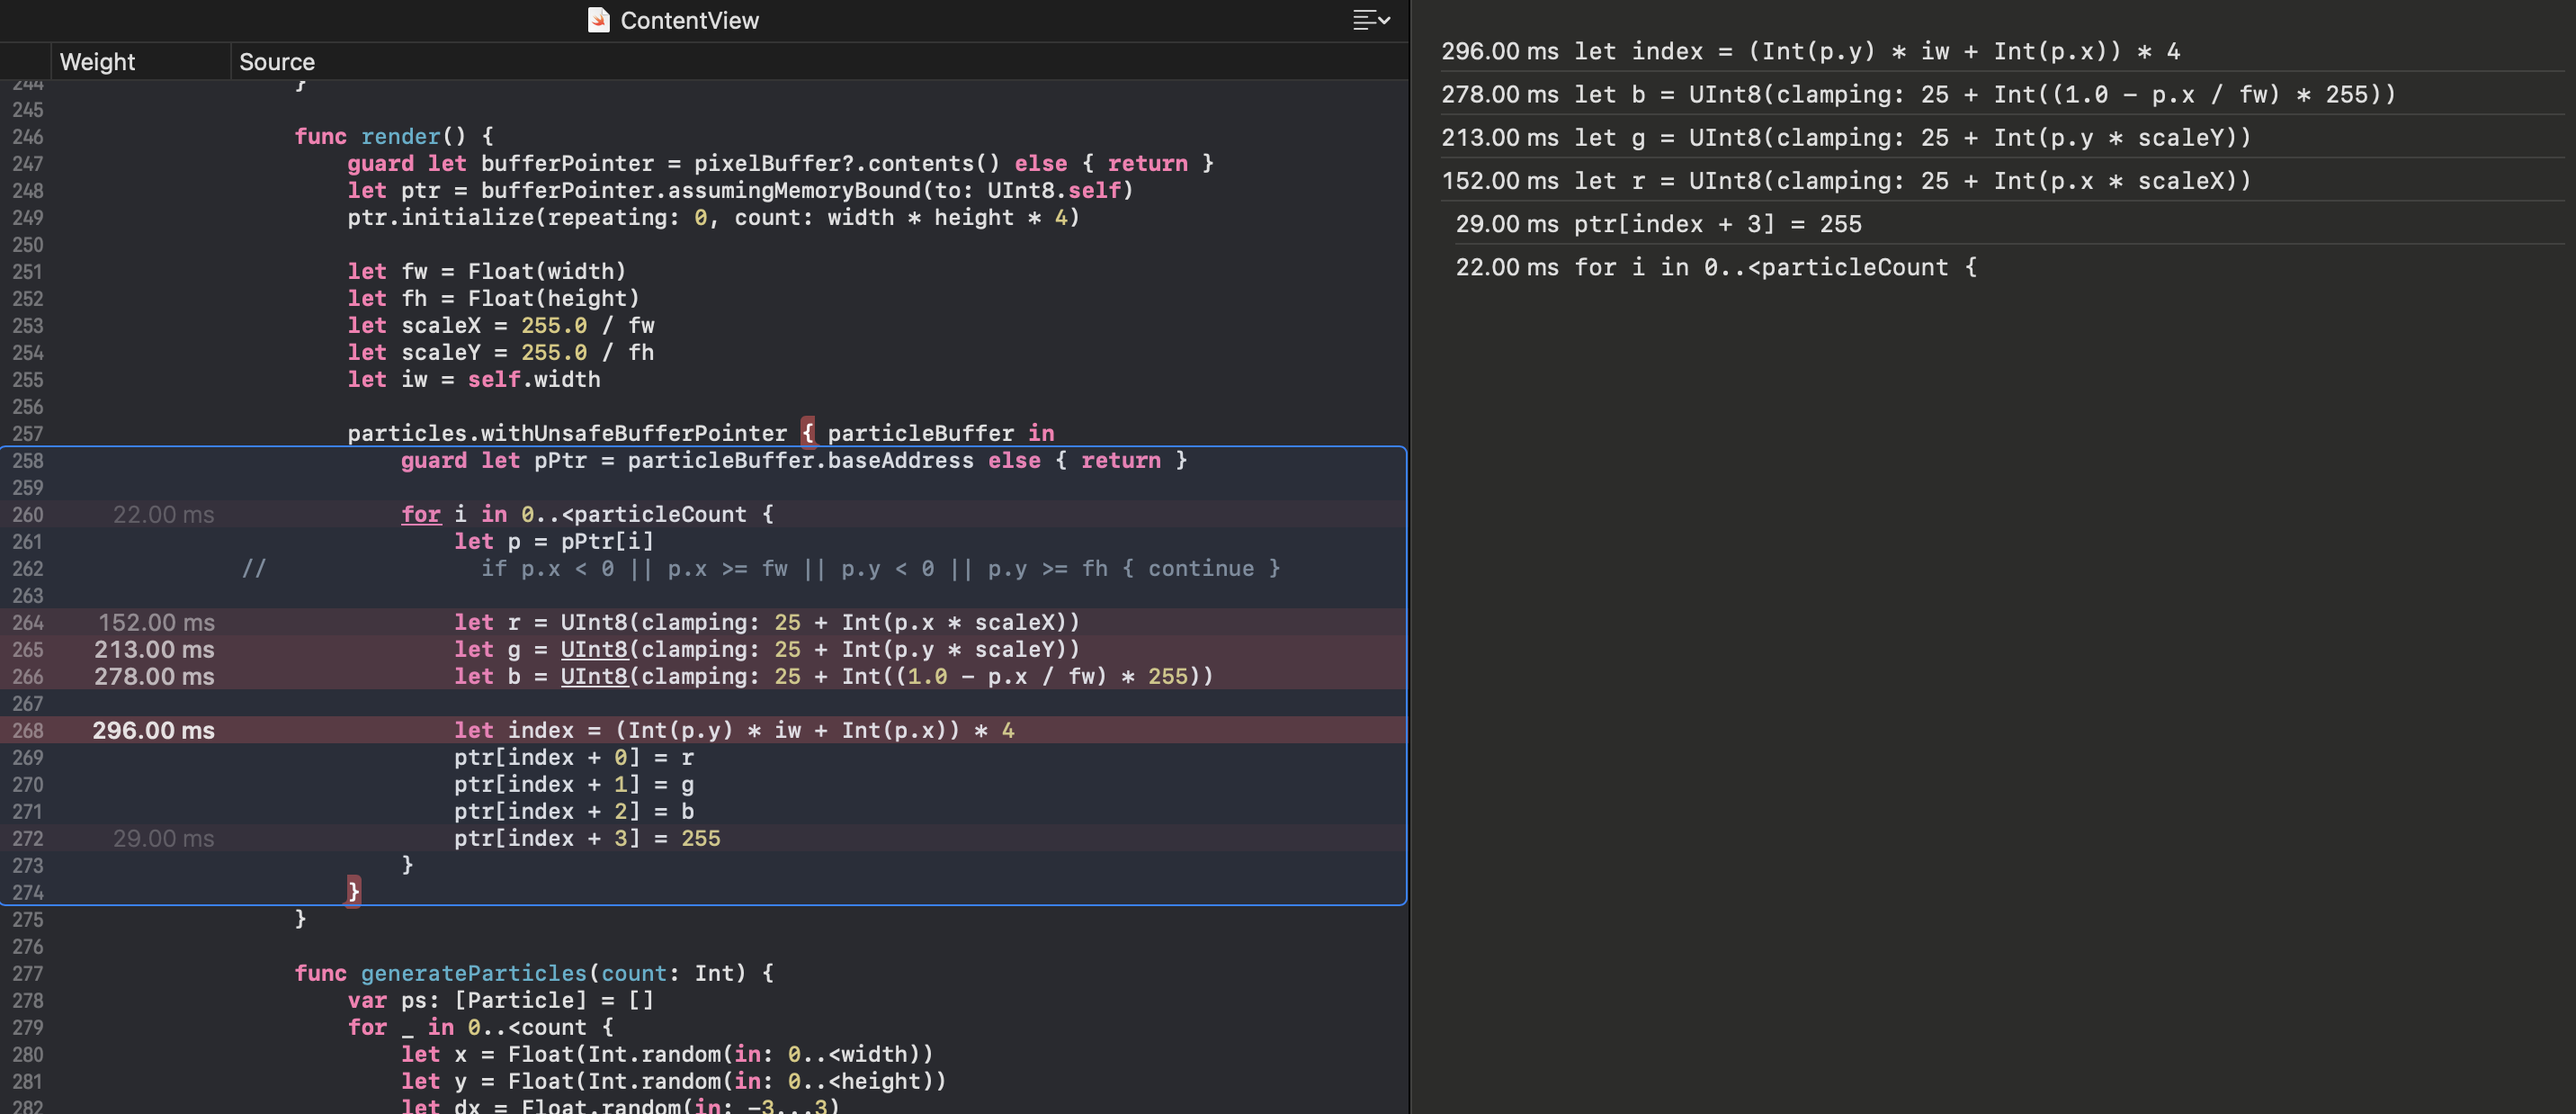
Just like in the other languages this is pretty slow due to the random way particles access the pixel buffer. What is interesting is that you can even get down to the lower level assembly too but we don't need to look there....yet. I did peak and saw it was already doing a bit of neon simd. Nice.
What is not interesting is that often when profiling the app refuses to capture input events. It takes a few window focus changes before it does capture. Odd.
Still, the chrome profiler often will not give you the line by line breakdown. Sometimes it does, sometimes it doesn't but Appo always gives me the play-by-play and compared to rust well, all I can say is.
Very impressive.
I played around a little with micro optimizing in the profiler like "branchless" simd selects which made some small difference but I think multi-threading is the next step here.
The Third Pass
Multi-threading. To be fast in multi-threading one needs to structure the problem such that there is never a need for words like, mutex, semaphore, atomic, or anything that implies locking. Luckily, distributed particle system updates are easily multi-threaded.
There are a few ways to do this swiftly. I asked gyptiy what the options were and they told me about queues and a Grand Global something dispatch queue. I don't know what the global thing was but the code for it look suspiciously rusty to me which made it the winner.
Now the code gypity gave me tried to do something where a thread would be kicked off per particle update. I think it thought this was a ray tracer. I knew that would be a bad idea because it would break any chance of simd but thought i'd give it a try. It was...slow.
So instead it is done closer to what rust and js did. For each thread, give it a chunk of particles to work on and then block the main thread until the spawned threads are all done. I want to say rust and swift make this far far FAR easier than web workers. Javascript. I love it.
func tick(dt: Float) {
  // local vars

  let numParticles = self.particleCount
  let particlesPerThread = (numParticles + numberOfThreads - 1) / numberOfThreads

  particles.withUnsafeMutableBufferPointer { particleBuffer in
    guard let particlePtr = particleBuffer.baseAddress else { return }

    DispatchQueue.concurrentPerform(iterations: numberOfThreads) { threadIndex in
      let startIndex = threadIndex * particlesPerThread
      let endIndex = min(startIndex + particlesPerThread, numParticles)

      for i in startIndex..<endIndex {
        var p = particlePtr[i]

        // unchanged update code

        particlePtr[i] = p
      }
    }
  }
}
I don't like the extra indentation of the withUnsafe and was told by my local swift guru (the aforementioned Apple acolyte earlier) that I should be able to get rid of it. Still, this is pretty darn clean.
The render function can also be distributed. As a little change up from previous language versions, I am going to do a last writer wins approach. I mean I was doing that previously too but didn't know that was what I was doing.
I will stick with coloring pixels based the particle position scaled by width and height. What this means is that threads can write to the same data location willy nilly without any issues since overlapping pixels don't change the final output. It is basically flagging if a particle exists or not.
func render() {
  // local vars

  let numParticles = self.particleCount
  let particlesPerThread = (numParticles + numberOfThreads - 1) / numberOfThreads

  particles.withUnsafeBufferPointer { particleBuffer in
    guard let particlePtr = particleBuffer.baseAddress else { return }

    DispatchQueue.concurrentPerform(iterations: numberOfThreads) { threadIndex in
      let startIndex = threadIndex * particlesPerThread
      let endIndex = min(startIndex + particlesPerThread, numParticles)

      for i in startIndex..<endIndex {
        let p = particlePtr[i]

        let clampedX = Int(max(0, min(fw - 1, p.position.x)))
        let clampedY = Int(max(0, min(fh - 1, p.position.y)))

        let r = UInt8(clamping: 50 + Int(p.position.x * scaleX))
        let g = UInt8(clamping: 50 + Int(p.position.y * scaleY))
        let b = UInt8(clamping: 50 + Int((1.0 - p.position.x / fw) * 255))

        let index = (clampedY * iw + clampedX) * 4
        // trust me bro, this is fine
        ptr[index + 0] = r
        ptr[index + 1] = g
        ptr[index + 2] = b
        ptr[index + 3] = 255
      }
    }
  }
}
Let's take it for a spin at say 20m? That is the number js would chug at.
Not terrible, faster than javascript but also slower than rust. What does the profiler say?
There is another view I will try out for this and it showed something interesting.
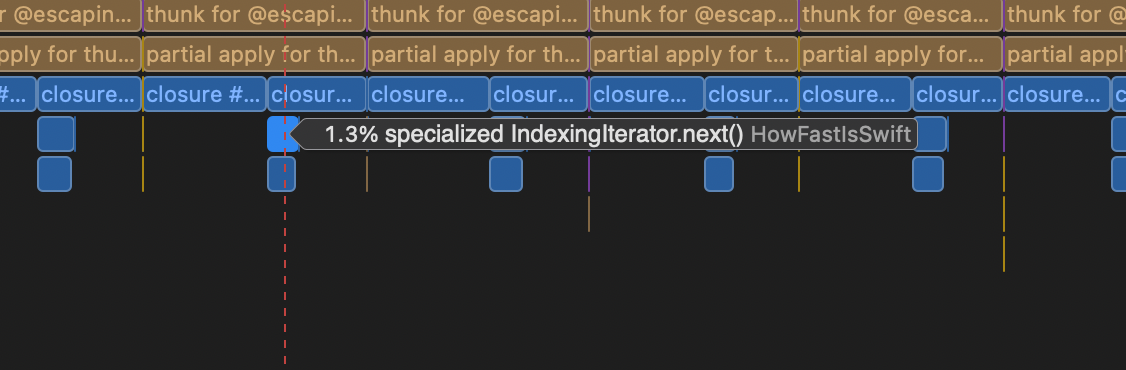
For each thread, there is this 1.3% time in a “specialized” iterator. Since there are 8 threads that is like almost 10% of the frame time. Well, this iterator is from this little bit of magic
for i in startIndex..<endIndex
What many often forget is that there is a cost to the nice sugar languages provide in syntax. I can get an almost 10% bump in performance by simply removing the sugar from my code.
It is interesting how code kinda echos real life no?
Now, there are a few more little micro optimizations to be had. If statements are slow and there are some clever ways to clamp out of bounds particles or wrap them without any ifs. These did provide a nice bump in their areas but there is another trick that can be done which is far more significant and it was also done in the rust/js versions.
Right now I am writing 4 bytes per pixel. In the other versions I wrote a single byte per pixel which saves on memory bandwidth. As we know, the more data that fits into all those cache levels, the better. Using 1/4th the memory will not be 3x as fast but it did provide a noticeable boost.
Memory speed is starting to become a bottleneck since so much data is being moved around. Think about it.
Each particle is 4 floats of data which is 16 bytes. At 20 million particles that is 320mb of data for the tick. Then the render is reading only the position and the pixel data which is 820m + 4resolution. Assuming 1080p, that would be 419201080 so 160mb + 8mb. This means each frame moves about half a gig of data. Not crazy but this needs to happen at 60 times a second which is 30g/s. This isn't unreasonable but my m1 only has a max of ~68g/s. The pixel buffer updates are thrashing the cache heavily but even then at the very best I could only double the sim to 40m before hitting the physical limit of the hardware. It is worth noting that I am testing at the full resolution of my m1 at 3360*1868 and resizing to a smaller window does indeed make the sim run much faster likely do to better cache hit rate AND moving around less memory which is really almost the same thing.
I can confirm memory speed being a bottle neck as the local Apple acolyte in my neighborhood has an m4 Pro which performs well over 5x faster. It has more cache and much faster memory but it only crunches numbers 50% faster, at least according to Apple.
The Fourth Pass
When I did this in javascript there was a small bit of cheating done moving to a grid of bytes rather than a full rgba pixel buffer. I used a pass through shader which did a tiny bit of coloring based on width and height on the gpu. Given Swift and Metal already require similar fragment shader I think it is fair to do the same.
The change is simple enough
pixelBuffer = device.makeBuffer(length: width * height, options: [.storageModeShared])

let textureDescriptor = MTLTextureDescriptor.texture2DDescriptor(
  pixelFormat: .r8Unorm,
  width: width,
  height: height,
  mipmapped: false
)
textureDescriptor.usage = [.shaderRead, .renderTarget]
textureDescriptor.storageMode = .shared
self.texture = pixelBuffer?.makeTexture(descriptor: textureDescriptor, offset: 0, bytesPerRow: rowBytes)
And then in the render function
let index = (clampedY * iw + clampedX)
ptr[index] = 1 // Set the byte to 1 to indicate particle presence
Note, I cannot count the number of particles without introducing a lock. Javascript supports SharedArrayBuffers which have some “magic” syncing which I learned is platform specific on how well the syncing works. I tried yolo swaggins'ing Swift to do the same, determinism be damned, but the app crashed which did surprise me a bit. Oh well, setting to 1 is fine.
The shader is ever so slightly different.
fragment float4 fragment_main(VertexOut in [[stage_in]], texture2d<float> imageTexture [[texture(0)]]) { // Change uchar to float
  constexpr sampler s(address::clamp_to_edge, filter::nearest);
  float pixelValueNormalized = imageTexture.sample(s, in.texCoord).r;
  if (pixelValueNormalized > 0) {
      return float4(in.texCoord.x, in.texCoord.y, 1.0, 1.0);
  }

  return float4(0.0,0.0,0.0,0.0);
}
This performs far better. Previously, 20m would run at around ~18-20fps. Now it runs at 35fps.
Before you say it I know some cycles are now on the GPU but most of this impact comes from moving less memory around and fitting more data into the cache. I know this isn't the most “scientific” measurement but given applying the attractor at 20m does not dip FPS, I think it means this is not compute bound, but memory bound. AND given the previous version setting full fat RGBA buffer ran FASTER when applying gravity using the ever so slow sqrt per particle, at 20m particles, this is still very much memory bound.
Now there is another thing that I could do to confirm this. Rather than have a step and render function which each iterate iterate over all the particles, I can combine them. It is rather simple and it will run at over 50 fps at 20m particles! When gravity is applied it dips down to the mid 30s which looks more compute bound. There is one issue though.
I will save your eyes dear reader and avoid showing you the EDM strobing light show. I am not sure why it did not do this before the merging tick() and render() because it really should have. The issue is that I am working on the buffer while it is also being drawn by the shader. Double buffering solves this but limits particles to a single value, on or off. I want that full 255 byte range.
Well, in both the rust and javascript versions I had a similar issue that I solved by giving each thread its own buffer to write particle counts to and then merging the buffers together on the main thread before rendering. I can even distribute the merging by giving having a thread merge a region of the buffer tile like.
Sadly, even without running the merge, giving each thread its own buffer is slower than if they wrote to the same buffer! Adding the merging step in makes it even slower bring 20m back down to the 30 fps range. What gives!
I think this is because the L2 cache and above on Apple silicon is shared across cores. If each thread has its own dedicated buffer and all the threads share the same L2 cache, there will be far more data needed to fit into the L2, 8x more data in fact. Since the access is still somewhat random the cache thrashing is even worse too. It would be nice to test this on another CPU arch but you know, Apple.
Another issue with merging the tick and render is it breaks some of the simd that was going on. The tick can handle 20m at well over 60fps if the render isn't part of it. But just like in javascript and rust, the render's cache thrashing nature brings the sim down. Spreading the slowness to more threads doesn't help much either. Lower resolutions do help since the particle count buffer is smaller and more will fit into the cache but I want 4k!
An interesting little pickle for sure.
I will keep with the merging and dedicated thread buffers for now. Without it the swift version is about half as fast as rust and about 3x as fast as javascript which were doing similar “not correct” things.
Rust is the clear winner here though.
The Fifth Pass
One little fun trick is that I can map particles to colors based on their index module 255. This means I can paint with 255 colors of the rainbow without any additional data. All I need to do is update the shader slightly and the placement logic...heavily.
This will consistently set a particles color without storing anything new.
localPtr[index] = UInt8((i % 5) + 1)
Then in the shader I can do a bunch of switches or some kind of loop up.
if (pixelValue > 0) {
  float3 color;
  switch(pixelValue) {
    case 1: baseRGBColor = float3(52.0/255.0, 116.0/255.0, 51.0/255.0); break;
    case 2: baseRGBColor = float3(255.0/255.0, 193.0/255.0, 7.0/255.0); break;
    case 3: baseRGBColor = float3(255.0/255.0, 111.0/255.0, 60.0/255.0); break;
    case 4: baseRGBColor = float3(178.0/255.0, 34.0/255.0, 34.0/255.0); break;
    case 5: baseRGBColor = float3(70.0/255.0, 130.0/255.0, 180.0/255.0); break;
    default: baseRGBColor = float3(0.0, 0.0, 0.0); break;
  }

  return vec4(baseRGBColor, 0);
}
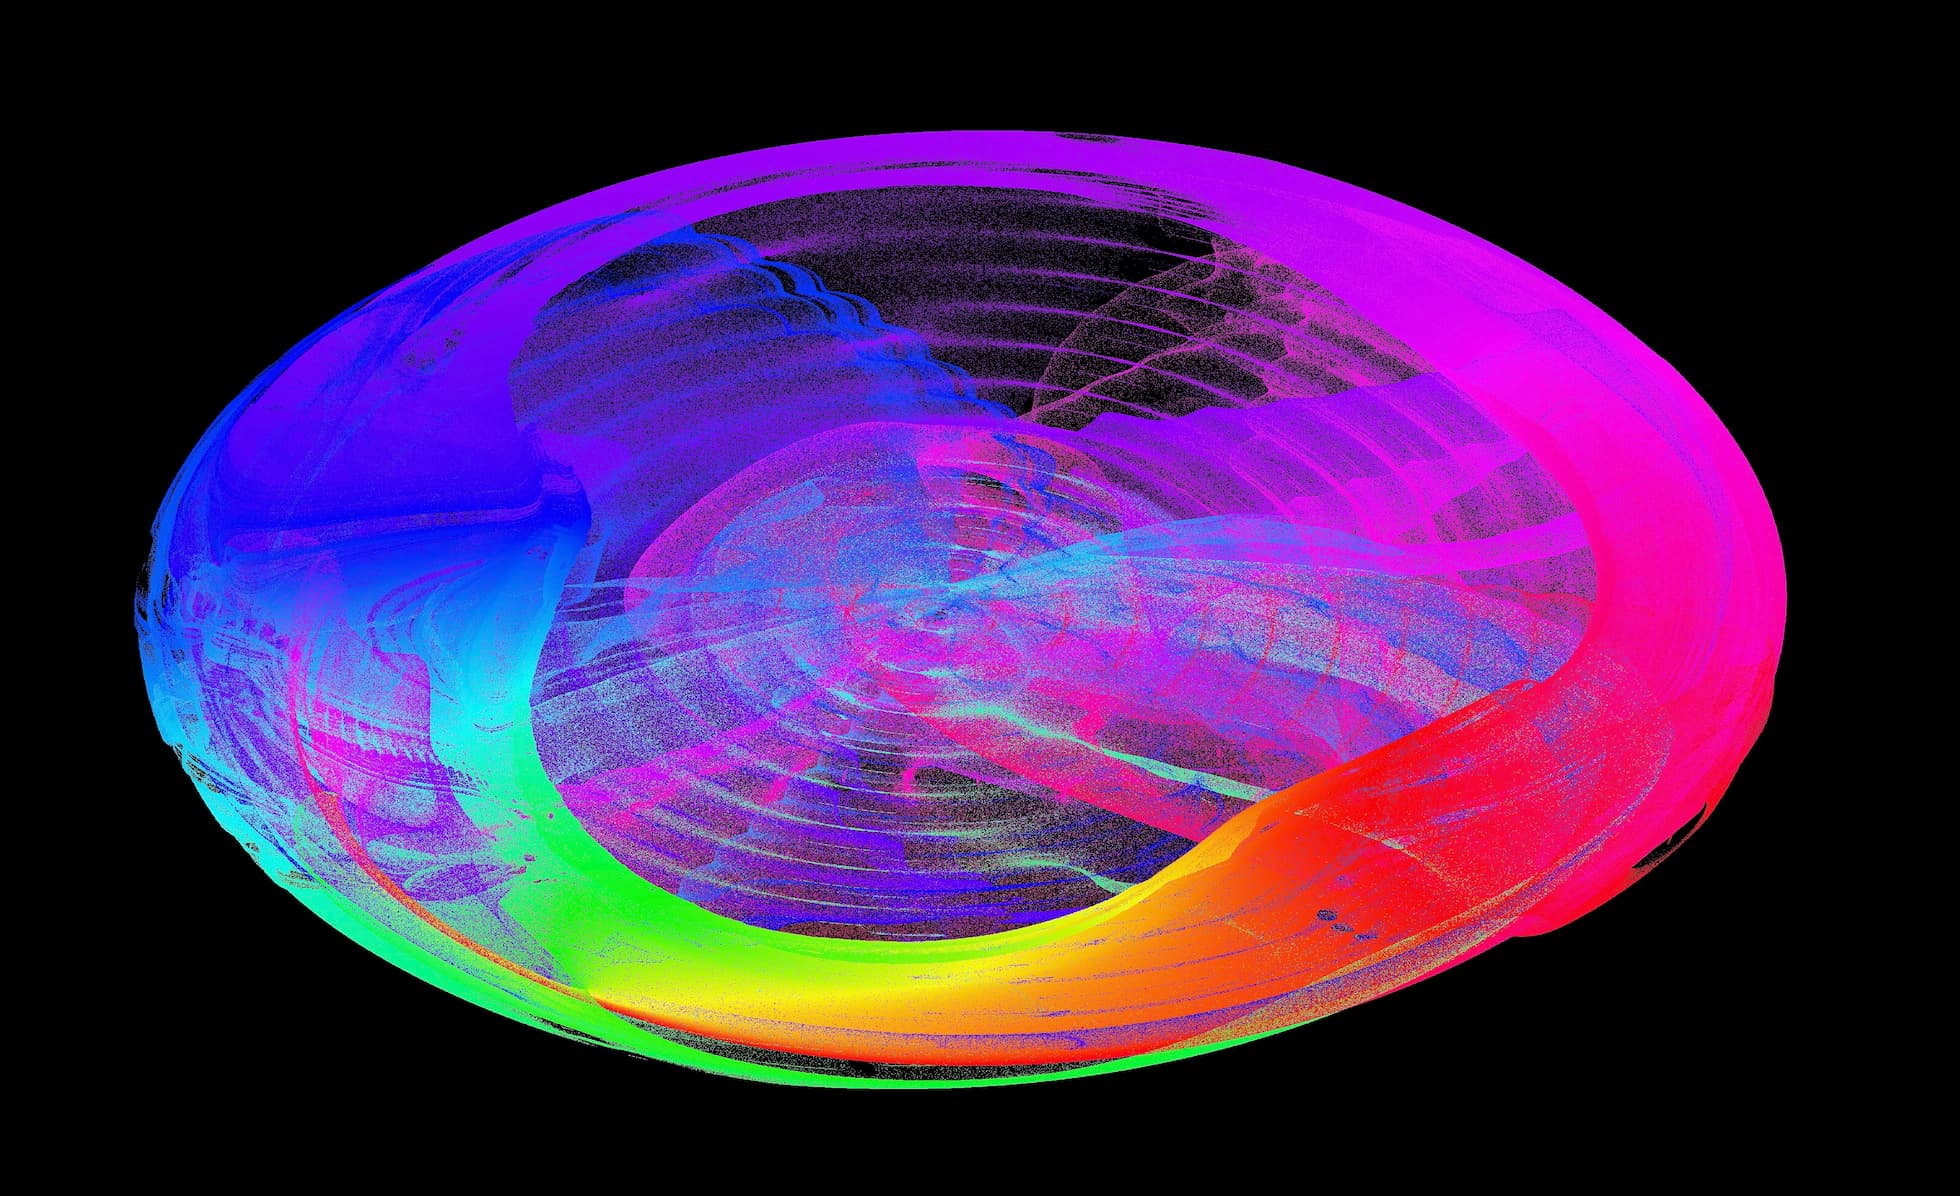
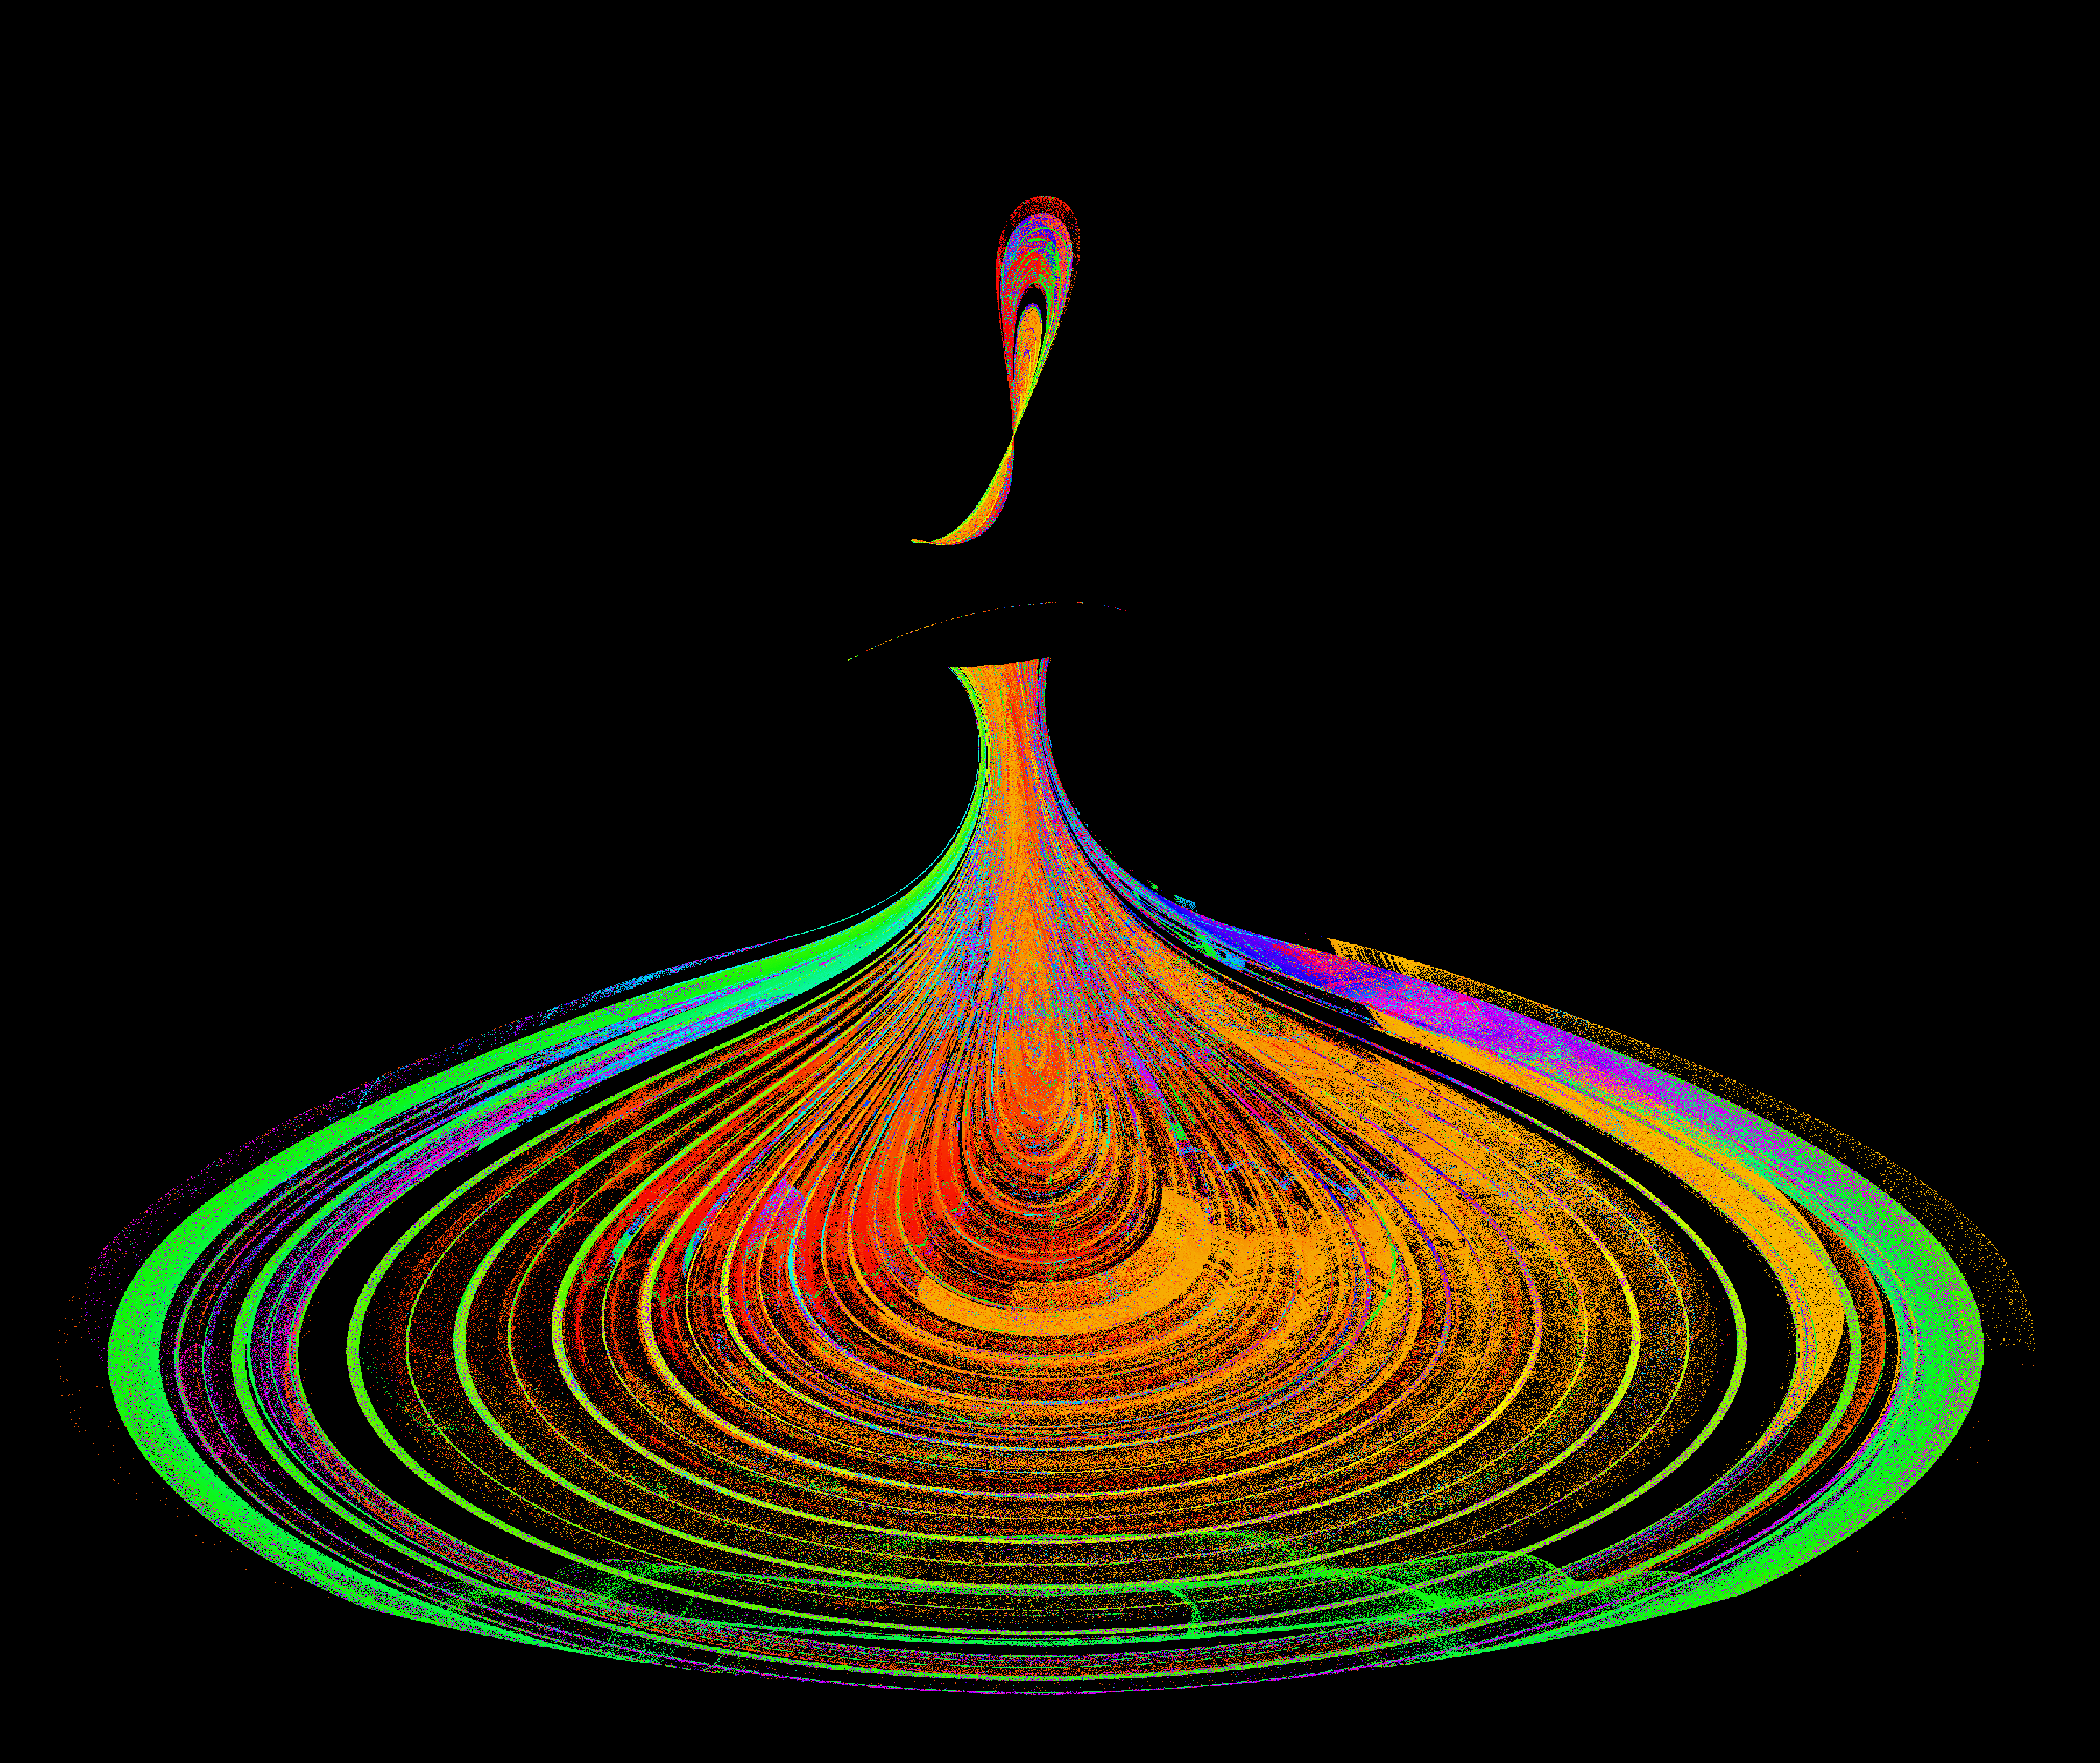
Sure it is a little hacky doing this in the shader but the results are fun. With a little special code one can place the pixels in spirals.

And more spirals

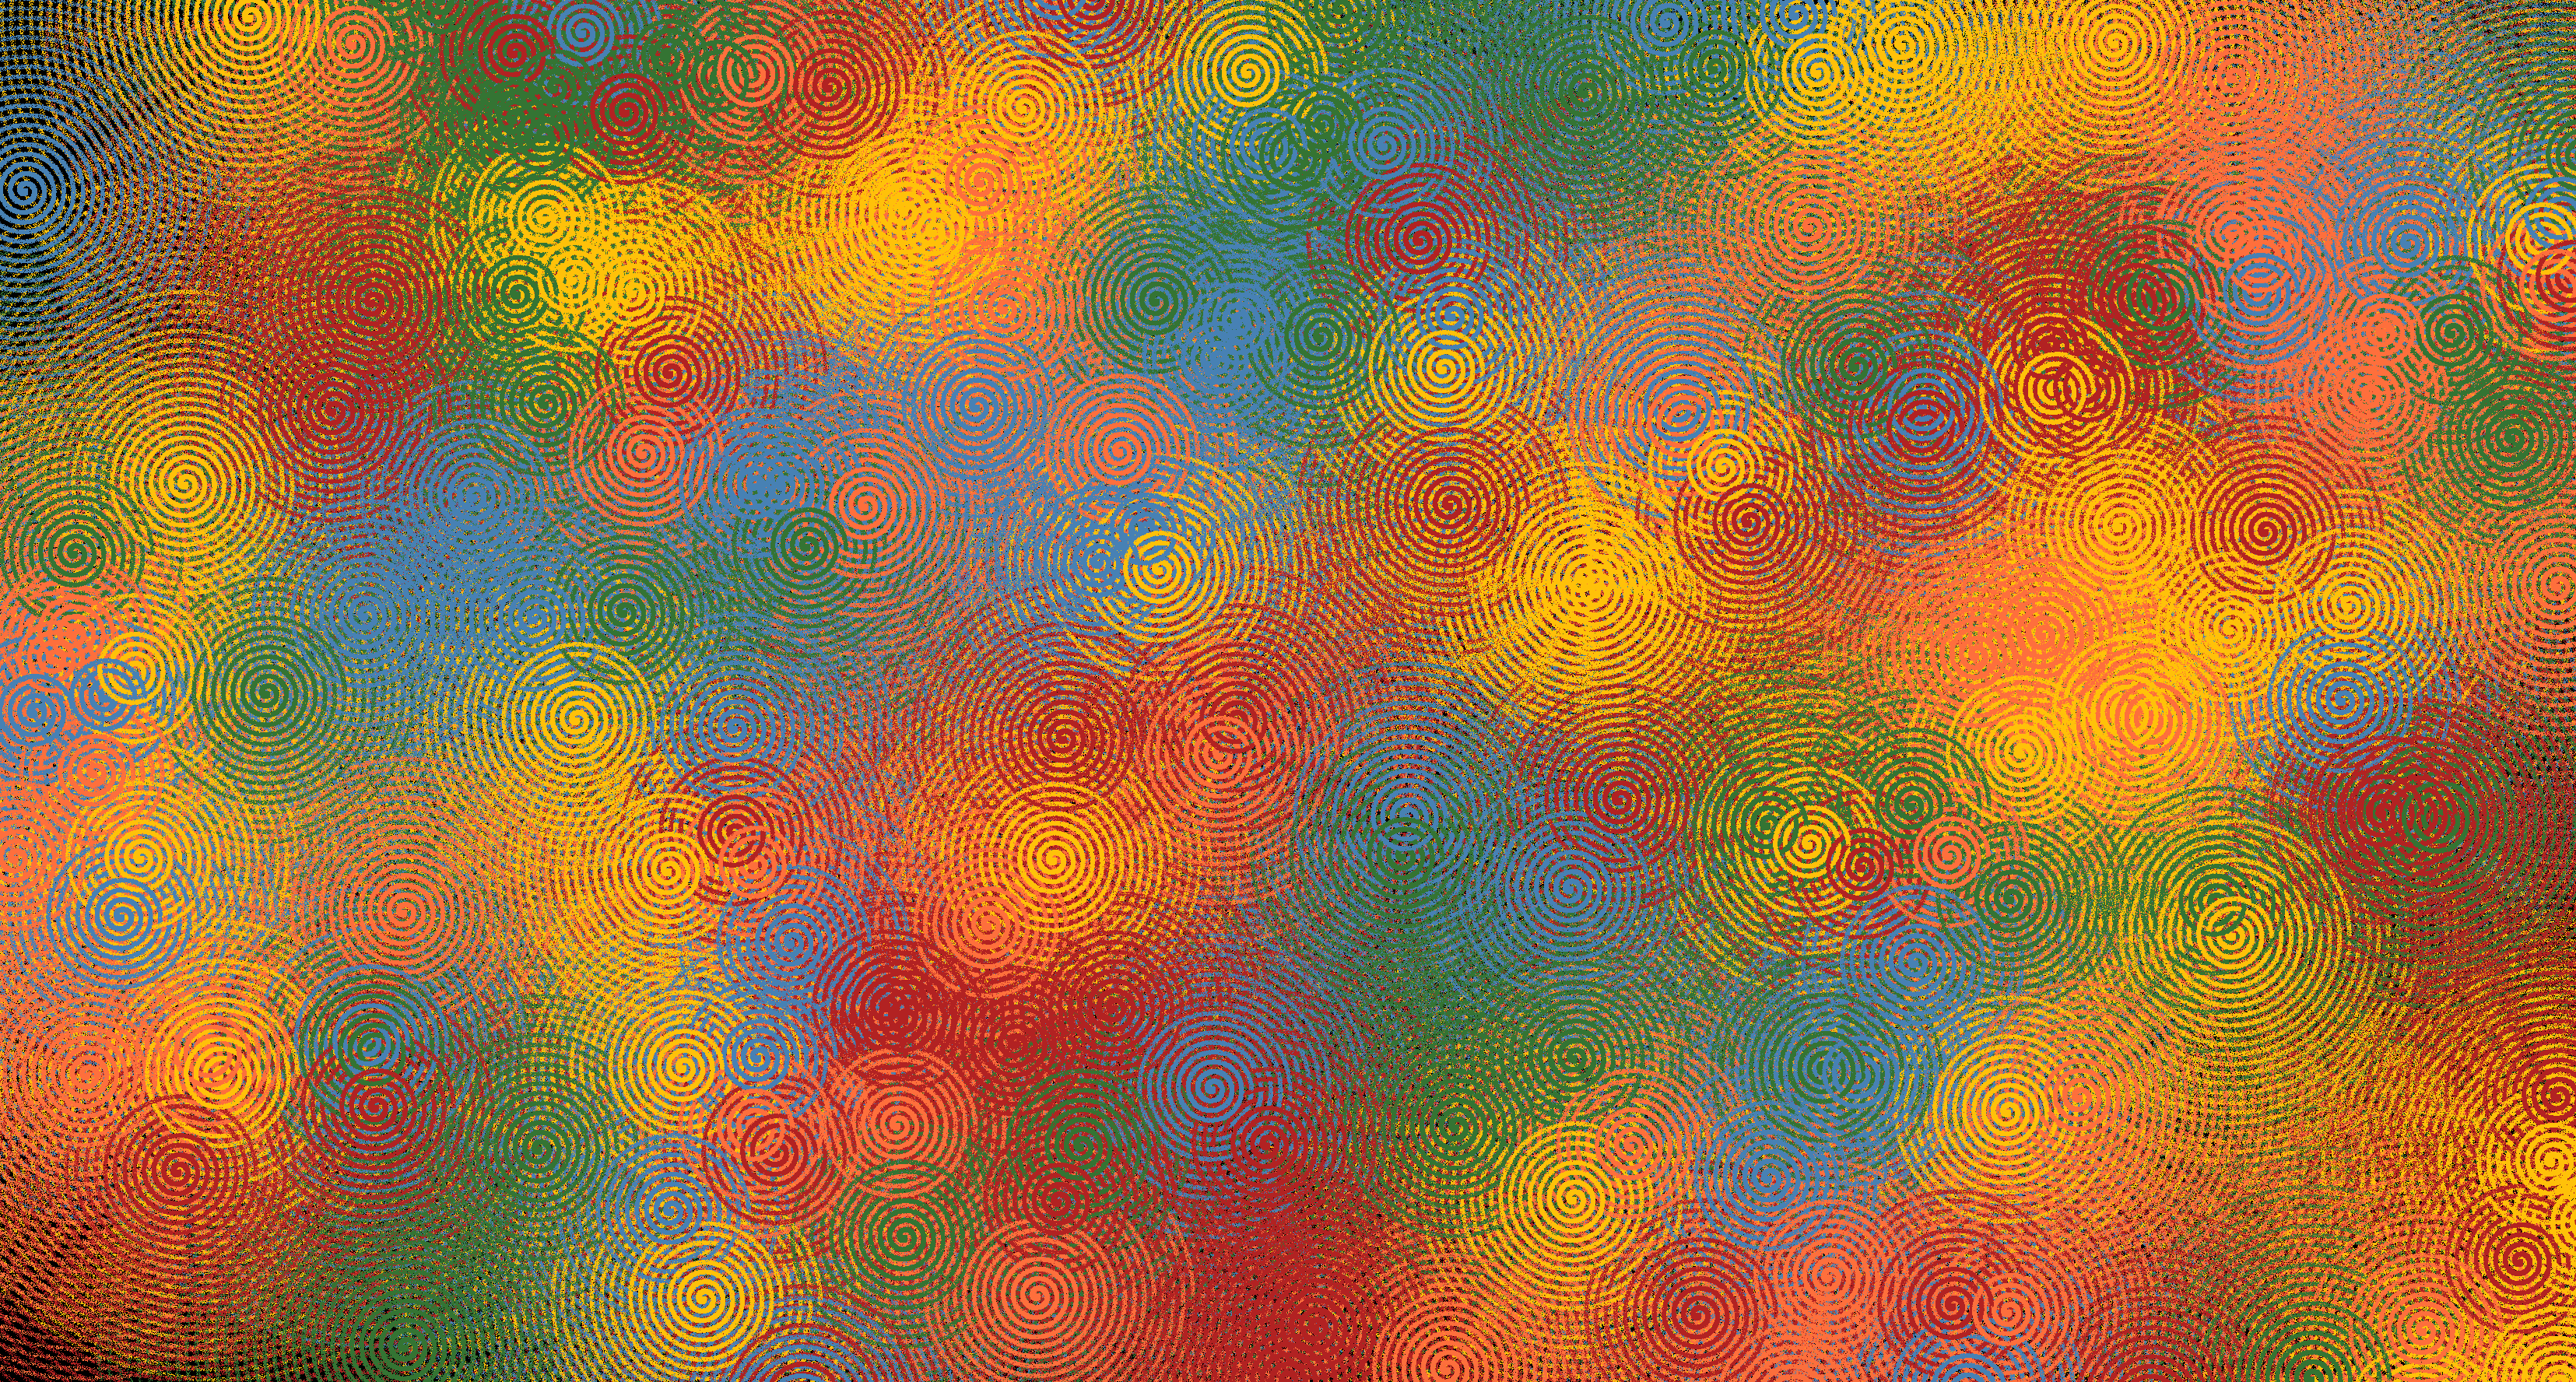
Small spirals kind of look like blobs of paint. Here is some 10s of millions. I recommend watching in 4k because anything less is a blurry smear.
I am sure with some preprocessing code one could downsample a picture into a palette of 255 and then place particles such that they would “paint” that picture. This is fun because you can see the nice layering better than if coloring was only based the existence of a particle at a pixel.
I know many will not get this far and comment, as they always do, something like this.
“gpu instancing would be faster”
No. You are wrong. Well, mostly wrong. Instancing requires sending all the data to the gpu every frame which falls apart past 1 million positions in my experience. However, with swifty boy and using a metal backed buffer, the memory is shared between cpu and gpu. So in theory, it should be fast. However, when I tried to use instance rendering with points, it barely did 5m at 20fps. I am not sure why this is and I don't trust AI's answer to it so if you dear reader happen to be an expert in this area, do let me know.
Now, the next thing everyone always says is, “awktually, a compute shader would be the, uhh, sniff obvious and correct solution.” Which brings me to the bonus round.
Heavy Metal Edition
Whilst I was toying around with all of this, the aforementioned Apple acolyte (Mr. Nardi) that inspired this whole thing was also in the kitchen.
Nardi said it would only be fair to measure swift if it included a full native Metal compute shader version too. Well he didn't say that specifically I did but I am going to pretend he did for the sake of narrative.
I know what you are thinking, that is cheating. I am sure Apple would argue that Apple silicon and the Swift language are uniquely intertwined such that one can't be compared without the other. Actually, Apple wouldn't say anything at all and would just point to the Heavy Metal version and say, “yup, you see that? that is the power of Apple silicon and the swift language. Only Apple can do that.” True and true but also certainly not true. I digress.
Let's see what Nardi cooked up.
I loaded up his xcode project and pressed the play button and I was in shock. At 50m particles it runs at 8fps where as the pure cpu version runs at ~13 fps. The heck?
There are a few differences though. In his version he stores a “home” location for each particle along with a full rgba color. This ends up being 28 bytes per particle. 50m is like a gig of data which is pretty big. Also, in the cpu version applying gravity causes the frame rate to drop a bit where as Nardi's pure metal version actually runs faster up to 20 fps depending on how grouped up the particles are.
It looks pretty cool and the “return home” feature is nice.
What is fun is that if I render to half resolution it runs ~40% faster. Scaling down the resolution does help the cpu version a bit although applying gravity drops the fps back to the ~10 range. I think this means Nardi's metal simulation is not bound by compute but memory speed. On his m4 pro he can get 300m particles at 50 fps which looks amazing.
i got shwifty
All the different iterations of code are in this gist. Each is a single file and in theory it should run on iOS too.
In the end, swift is indeed much faster than javascript but still slower than rust. Nardi predicted this result, as I am sure you did too, although he still loves swift and thinks it deserves more attention, I agree.
Rust got 200m particles at 8 fps and 100m at 16 which was about as fast as javascript at 20m. At a similar render resolution swift hit 100m at 6-10 fps depending on if gravity was running so maybe half as fast as rust but still faster than javascript.
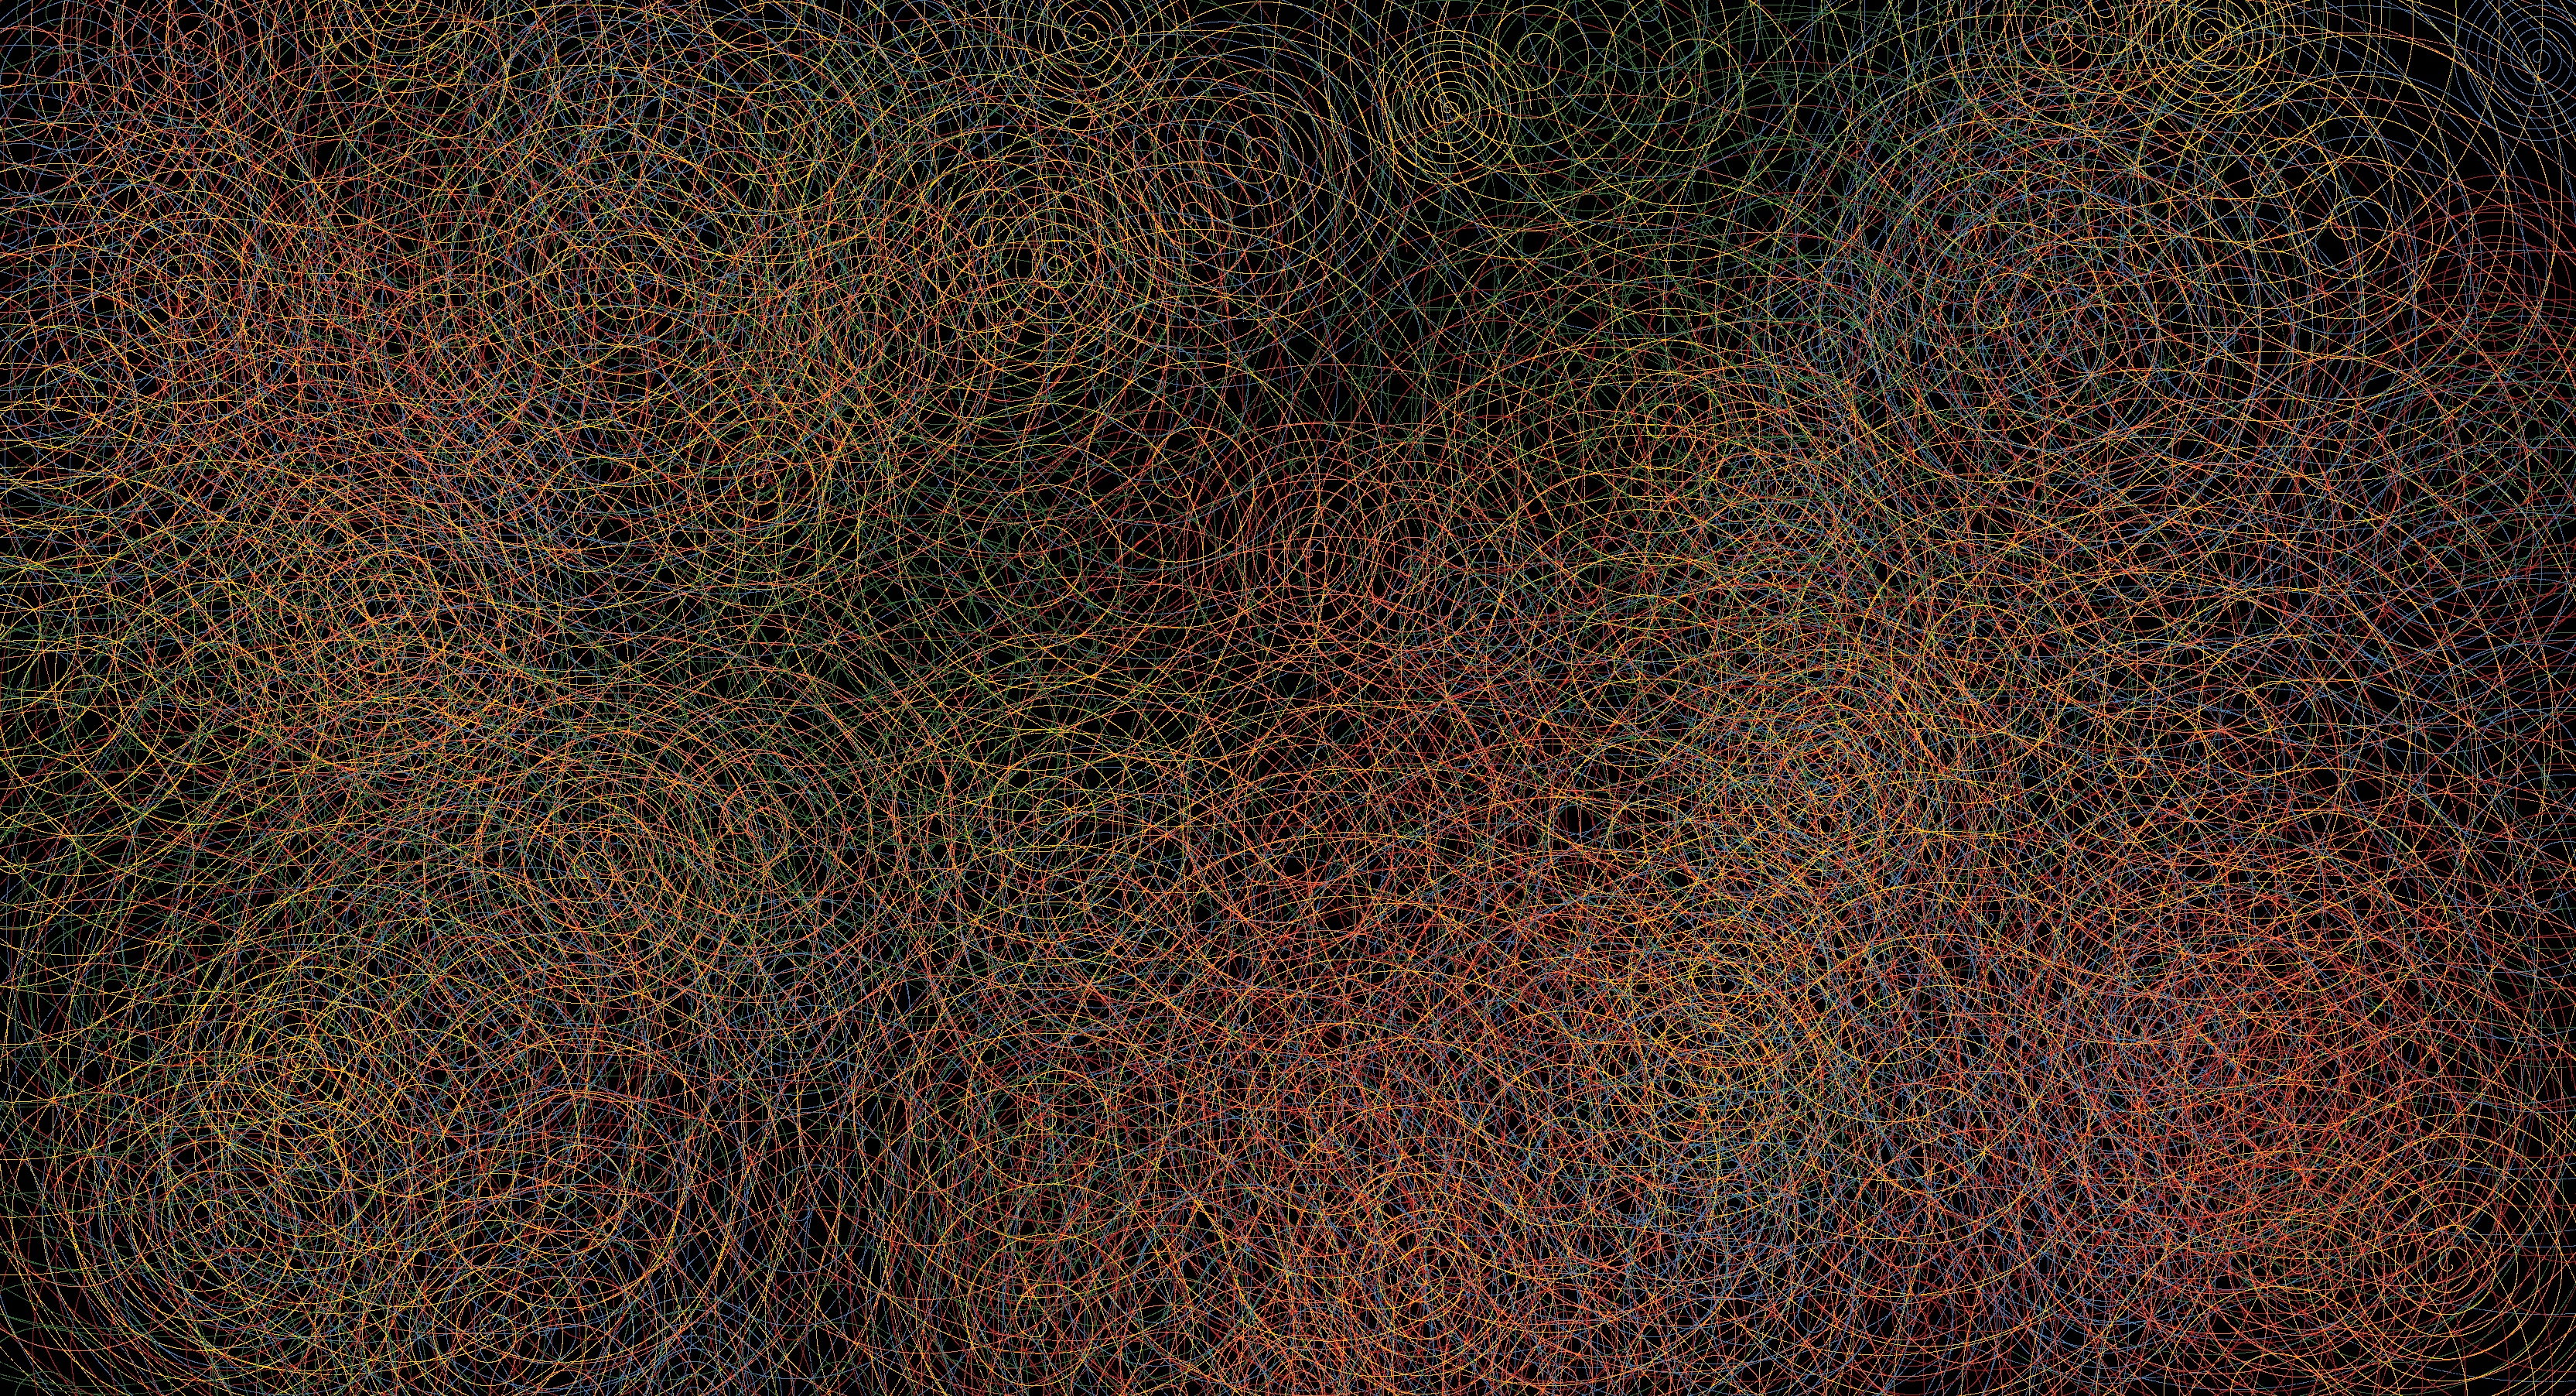
Here is 100m swift particles chugging along. It starts off almost like one of those polloc paintings.
Swift is like a cute little cat locked in the garden of Apple; a garden with a very tall and a very electrified fence. Every now and then, when Tim Apple isn't looking, we get a glimpse of the swifty kitty looking longingly outside the garden, wondering what it could really do out there if only it were free.
Before you go, here are some fantastic pictures Nardi sent simulating 100s of millions of particles on his fancy m4 pro using Swift Heavy Metal Edtion. Imagine what a m4 pro max ultra supreme could do!
Until next time.