How fast is javascript? Simulating 20,000,000 particles
The challenge, simulate 1,000,000 particles in plain javascript at 60 fps on a phone using only the cpu.
Let's go.
Ok, this is not a particularly difficult challenge if you did all the work on a gpu but the rule of the challenge is to use the CPU only or as much as possible and to stay in js land so no wasm.
I know what you are thinking. This isn't too hard. Just create an array and stick a million objects in it.
Something like this maybe?
const count = 1_000_000;
const particles = new Array(count).fill().map(() => ({
	//particle information
});
Then you would just loop over your particles with something like this
function simulate(deltaTime) {
  particles.forEach((particle) => {
    //update particle
  });
}
And assuming this is on a browser just toss that in a request animation frame with a canvas for rendering
requestAnimationFrame(simulateAndRender);
Now, this may be enough if you have a single fast cpu but mobile devices are not known for their single core performance. They have many small power efficient cores. And to hit the target, one million particles, I need to get as they say

Pop quizz
What is the fastest, most stablest, and predictable way of doing lots and lots of computations in any programming language?
Tightly packed contiguous arrays of data.
What are tightly packed contiguous arrays of data?
Idk, what does the internet say,
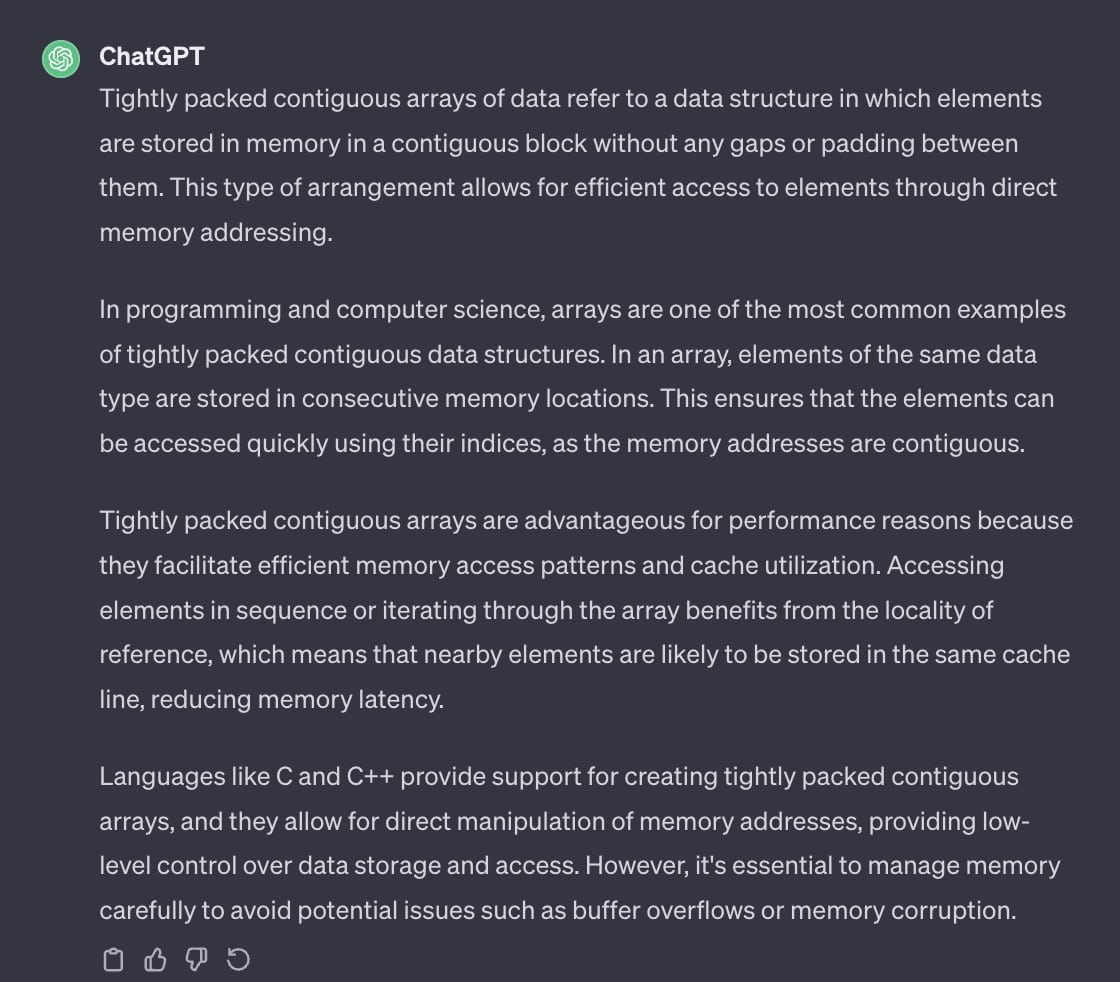
So, based on gipity, if you want to go fast, you need to keep as much data as possible in your cpu's cache. It doesn't matter what language you are in, this always holds true. If you are just going over big arrays of data and running some computations, which is what I will be doing, then the most important thing is to make sure the cpu is never waiting for data.
And since this is in javascript it is also good to avoid creating garbage more so for stability than speed but I am not going to worry about that too much right now. I can cleanup garbage code later on. Best to get something working first then I can profile and optimize.
Pop quizz 2
How can you guarantee you have a tightly packed contiguous array of data in javascript?
If you do something like this
const myArray = [...myData, myOtherData];
or maybe this
const myArray = [];
myArray.push({
  data: "hello there",
});
you are wrong.
While v8 and other javascript engines are smart and will optimize like mad, arrays in js are not always guaranteed to be real contiguous arrays of data like they are in other languages especially if they are filled with objects.
Also, objects in javascript are not as tightly packed as they could be in a real

systems language either.
If I had an object like this in javascript
const obj = {
  x: 11.01,
  y: -17,
};
it takes up more space in memory than just the two 32-bit floating point numbers. Lower level systems languages have a way to organize data similar to an object but without the overhead of objects. This is commonly referred to as a struct or structure.
struct {
  int x;
  int y;
} Particle;
Sadly, javascript doesn’t support anything quite like a struct
Luckily, javascript does support TypedArrays. TypedArrays are as close as you can get to

programming in javascript. They let you create a fixed sized array of contiguous bytes in memory. As close to low level memory management as one can get. I can use a TypedArray to store the particle data and guarantee the memory is tightly packed and contiguous.
Cool, enough theory, time to go for a working example.
The First Pass
I know I need to have the simulation run across all cpu cores and I know that web workers are the javascript way of multi-threading. Ya, jumping into multi-threading likely isn't the best first pass but it has to happen. My first idea was to use a giant SharedArrayBuffer (a special kind of typed array) which in theory should let me distribute the work to a bunch of web workers. SharedArrayBuffers in javascript allow you to share any TypedArray across web workers and the main thread with “eventual visibility” whatever that means. Basically, easy mode multithreading without having to worry locks. Cool stuff.
~foreshadowing foreshadows~
I decided to use a “signaling” SharedArrayBuffer” for communication between the main thread and worker threads relying on the “eventual visibility” feature. This way the workers can wait until the main thread signals them to run another simulation tick and the main thread will know when all the workers are done simulating. Keep in mind, as long as only one worker ever reads/writes to a location in memory, I never need to worry about syncing data access between workers.
This is how many languages make multi-threaded code easier to manage. The idea is to try as hard as possible to never have a case where more than 1 thread needs to read/write to the same bit of memory. Multiple threads reading the same memory can generally be safe (foreshadowing) but multiple writing is what really gets you.
Why is it bad to have multiple threads writing to the same memory? Determinism or the lack there of. When two thread read and write to the same memory location there isn't a guarantee in the order of operations. Sometimes thread A writes first and other times it is thread B. This leads to nondeterministic results.
A mutex or semaphore can be used to allow for deterministic memory access but they can be complicated to get right. Javascript does support an Atomics API but it uses promises which are gross. Eww sick.
For now, I am going to do everything in my power to avoid a case where two threads write to the same location in memory.
I ran into an issue getting SharedArrayBuffers setup as the browser requires a few special headers for them to work. Something about the spectre cpu hacks? idk.
But for reference this is all you need to set in your headers for sharedarraybuffers to work.
headers: {
  "Cross-Origin-Embedder-Policy": "require-corp",
	"Cross-Origin-Opener-Policy": "same-origin",
}
Now that I can create a SharedArrayBuffer it is time to figure out how I am storing data.
I decided to have each particle be represented by 4 numbers an x, y, dx, and dy. These will each be 32-bit floating point numbers. It is a good idea to use a concept of “stride” when working with flat chunks of memory like this. It will help keep you sane. Storing data like this is called a flat buffer and is common in GPU programing.
Here is what creating the particle data with a SharedArrayBuffer looks like.
const stride = 4; // 4 floats x,y,dx,dy;
const byte_stride = stride*4; // 4 bytes per float
const sabParticles = new SharedArrayBuffer(PARTICLE_COUNT * byte_stride);
const sabViewParticles = new Float32Array(sabParticles);
...
//init particles
for(let i = 0;i < PARTICLE_COUNT;i++) {
	sabViewParticles[i*stride] = Math.random() * canvas.width;
	sabViewParticles[i*stride+1] = Math.random() * canvas.height;
	sabViewParticles[i*stride+2] = (Math.random()*2-1)*10;
	sabViewParticles[i*stride+3] = (Math.random()*2-1)*10;
}
It is worth noting that SharedArrayBuffers require using a “view” into the data since natively it is a bunch of unsigned bytes. In this case I am using a Float32Array view.
The simulation will be simple. Add the dx and dy to the x and y. That's it.
Great. Nice.
Now, how am I going to draw a particle to the screen? What will they look like? Circles? Squares? Cubes? Space Unicorns? idk.
I decided to use an ImageData object where each particle will be a single pixel in size. ImageData is an object that is part of the browser spec for working with pixel data, an obvious choice for me. I can use an html canvas to draw the ImageData's pixels to the screen. This is basically a cpu based rasterizer so this keeps with the theme of doing just about everything on the cpu.
This also keeps the code pretty simple as I don't have to deal with any libraries or boilerplate GPU code which can be a beast anyone in the know would tell you or so they have told me.
Here is the render function.
function render() {
  const width = canvas.width;
  const height = canvas.height;
  backbuffer.data.fill(0); // ImageData
  for (let i = 0; i < PARTICLE_COUNT; i++) {
    const x = sabViewParticles[i * 4];
    if (x < 0 || x >= width) continue;
    const y = sabViewParticles[i * 4 + 1];
    if (y < 0 || y >= height) continue;
    const pixelIndex = ((y | 0) * width + (x | 0)) * 4;
    backbuffer.data[pixelIndex] += 30; // Red channel
    backbuffer.data[pixelIndex + 1] += 40; // Green channel
    backbuffer.data[pixelIndex + 2] += 65; // Blue channel
    backbuffer.data[pixelIndex + 3] = 255; // Alpha channel (opacity)
  }

  context.putImageData(backbuffer, 0, 0);
}
I have a confession here. I 100% used chatgpu to help deal with indexing into a flat buffer of pixel data like this. You can tell because I left the useful GTP comments in. The backbuffer data has 4 unsigned bytes per pixel. I always set alpha to the max value of 255. I will add a bit of color per particle until all channels are 255 which is white. I also make sure to skip any particle which is outside the screen. This is a form of both culling particles we don't need to draw and preventing indexing outside the bounds of the array.
If you are interested in how I use GPT to help write code from custom protobufs to ray tracers, don't ask because I am terrible at it.
It is pretty easy to hook this render function into a request animation frame and it is also pretty easy to signal the workers.
let lastTime = 1;
function runSimulation(currentTime) {
  const dt = Math.min(1, (currentTime - lastTime) / 1000);
  lastTime = currentTime;
  sabViewSimData[0] = dt;
  for (let i = 0; i < CPU_CORES; i++) {
    sabViewSignals[i] = SIGNAL_RUN;
  }
  render();
  requestAnimationFrame(runSimulation);
}
I added a basic delta time calculation to handle variable frame rate. Calculating a delta time like this is not perfect in all simulations but it is good enough here. I should also mention that I use another SharedArrayBuffer to store shared simulation data like delta time. The workers will never write here so I don’t care about syncing it. It is fine if there is a little latency.
One nice thing here is that rendering is decoupled from the simulation. On each requested frame, I tell the workers they can run again and render whatever the latest data is.
All that is left is setting up the workers
//setup workers
for (let i = 0; i < CPU_CORES; i++) {
  const worker = new Worker("./worker.js");
  workerPool.push(worker);
  worker.postMessage({
    sabParticles,
    sabSignals,
    id: i,
    chunkSize,
    chunkOffset: chunkSize * i,
    stride,
    sabSimData,
  });
}
You can get an idea of how to distribute work across many cores here. The theme is always the same. Break up data into chunks and send the chunks to a pool of workers. I only need to send one post message which contains the SharedArrayBuffers along with a few other useful bits of data.
The worker code is a little disappointingly basic.
setInterval(() => {
  if (signalsView[id] !== SIGNAL_RUN) return;
  const delta = dt();
  for (let i = chunkOffset; i < chunkOffset + chunkSize; i++) {
    particlesView[i * stride] += particlesView[i * stride + 2] * delta;
    particlesView[i * stride + 1] += particlesView[i * stride + 3] * delta;
  }
  signalsView[id] = SIGNAL_READY;
}, 1);
I know i know. Am I really using setInterval with 1ms as a way of “sleeping” between checks on the signal from the main thread? Yes. Did I know that intervals and timeouts can't actually run in less than 4ms? Nope. Does it work? Yes, yes it does.
Now the compression of a video will make this look absolute doodoo butter so please try and run a live version here just run bun http.ts in the terminal. Codesandbox isn't what it used to be. If any show a credit issue, fork the devbox or DM me for source code. All that happens is just updating particles positions and rendering the frame. It looks rather nice and there are a million particles. Challenge complete?
Lets take a look at the profiler to see if all the cores are being used.
And it looks like there are a bunch of workers doing stuff.
You can see the interval checks running too. Nice.
Not much time is spent in each worker. Barely a few milliseconds. Most of the time is spent rendering the particles to the screen on the main thread.
If you notice, almost no garbage is created since memory is allocated once at the start and nothing is created in the sim loop.
This is a good start.
Right now 1 million particles are simulated and they barely use all the cores. There is plenty of budget available to add some interactivity to the simulation.
A fork of the codesandbox I worked from and on to the second pass.
The Second Pass
The idea I had for interactivity is pretty basic but I need to get input data passed to the workers first.
To communicate input to the workers I will reuse the earlier simulation state SAB (sharedarraybuffer) which had the delta time in it. I can add a few input listeners to the window and set the input data as needed. Any updates from the main thread will “eventually” reach the workers.
// dt + mouse x + mouse y + touch down + screen with + screen height
const sabSimData = new SharedArrayBuffer(4 + 4 + 4 + 4 + 4 + 4);
// event listeners
window.addEventListener("mousemove", (e) => {
  sabViewSimData[1] = e.clientX;
  sabViewSimData[2] = e.clientY;
});
window.addEventListener("mousedown", (e) => {
  sabViewSimData[3] = 1;
});
window.addEventListener("mouseup", (e) => {
  sabViewSimData[3] = 0;
});
It may be a good idea to create named stride offsets to make indexing into shared data like this easier but this is fine for now. Note, I am using 4 bytes for everything here even though the touch status is a boolean value which only needs a single bit. I am sure in another language it would be easier to structure this but this is good enough.
Armed with access to input data it is time to add interactivity. I want it to work in a way where anywhere you touch on the screen will cause the particles to pull towards the touch point using some kind of approximation of gravity.
There is only one problem. I have been to a single physics class in my life. And no I don't mean I took a class but I went to the day 1 lecture of physics 2 because you didn't need physics 1 and noped right out. Physics is scary. Even scarier than math. But I do know that gravity has something about an inverse square. Luckily, my partner has a physics degree. She kindly provided me with an equation.

Force is equal to G, the gravitational constant, times the mass of both objects, m1 and m2, divided by r squared where r is the distance between the objects.
I did try to implement this exactly with all the right numbers (i think) but it gave uninteresting results. Part of this is because for an accurate simulation there wouldn't be any friction which means objects would accelerate infinitely and quickly go offscreen. The numbers also become insanely large without having the sim scaled to some unit representation. I was not looking for something perfectly accurate but interesting and interactive. I modified and tweaked the force equation a bit to give something more fun.
the updated simulation code isn't too bad
const delta = dt();
const [mx, my, isTouch] = input();
for (let i = chunkOffset; i < chunkOffset + chunkSize; i++) {
  const decay = 1 / (1 + delta * 1);
  const x = particlesView[i * stride];
  const y = particlesView[i * stride + 1];
  let dx = particlesView[i * stride + 2] * decay;
  let dy = particlesView[i * stride + 3] * decay;

  if (isTouch) {
    const tx = mx - x;
    const ty = my - y;
    const dist = Math.sqrt(tx * tx + ty * ty);
    const dirX = tx / dist;
    const dirY = ty / dist;
    const force = 3 * Math.min(1200, 25830000 / (dist * dist));
    dx += dirX * force * delta;
    dy += dirY * force * delta;
  }
  particlesView[i * stride] = x + dx * delta;
  particlesView[i * stride + 1] = y + dy * delta;
  particlesView[i * stride + 2] = dx;
  particlesView[i * stride + 3] = dy;
}
The first thing is to add a little friction to the velocity of the particles. This prevents particles from accelerating off into oblivion. Then, if the screen is touched, calculate a force based on the direction to the touch point and the particle. Finally, update the particle’s location based on the dx and dy.
The force uses a constant for mass and the inverse square of the distance right out of our gravity equation. I limit this value and then multiple the result by 3. This multiplication kinda flattens the exponential function a bit which I found to be more interesting. It can be fun to play around with the values here. There are many artistic liberties to be had. If you do play around, feel free to throw in a few more magic constants. I won’t tell anyone if you don’t. ;)
I changed how the particles are rendered slightly.
for (let i = 0; i < PARTICLE_COUNT; i++) {
  const x = sabViewParticles[i * 4];
  if (x < 0 || x >= width) continue;
  const y = sabViewParticles[i * 4 + 1];
  if (y < 0 || y >= height) continue;
  const pixelIndex = ((y | 0) * width + (x | 0)) * 4;
  const rx = x / width;
  const ry = y / height;
  pixels[pixelIndex] += 25 + 50 * rx; // Red channel
  pixels[pixelIndex + 1] += 25 + 50 * ry; // Green channel
  pixels[pixelIndex + 2] += 25 + 50 * (1 - rx); // Blue channel
  pixels[pixelIndex + 3] = 255; // Alpha channel (opacity)
}
I color the rgb channels based on the position of the particle on the screen. Now when you pull particles to different parts of the screen, you will get different colors. Particles could each store their own color but this would double the size of a particle and I want to keep the data small for now.
I love this. I can play around with 2 million particles for hours and have! You can use a query param "count" in the url to set any number of particles you want. Video compression will not do it justice. You can try it out here.
What about 10 million?
Yup, the frame rate has dropped at this number. Delta time can only help so much with keeping a smooth experience.
Let’s look at the profiler and see what is going on here.
Ah, no surprise here. The workers are still barely doing anything! Even with a huge number of particles. However, the main thread is slowing down when drawing the particles to the screen. It seems drawing 10 million particles is a bit slow.
I can use the chrome inspector to find the offending code. And it looks like the slow part is setting the pixels on the image data.
I can validate this by updating the code to set only the blue and alpha channel.
This gives a significant boost to performance. From around 80-90ms to 16-18ms. Now, this difference is dependent on the cpu you are using. The difference is much less noticeable with the M1 chip on my macbook air than it is on the ryzen in my desktop. There is a reason for this which we will cover in the next few iterations as we explore optimization strategies.
Already though this will run on a phone with 1 million particles at close to 60 fps. It isn't fast enough nor stable enough to be called done though.
Time to take a few optimization passes
The Third Pass
I have a basic particle simulation which can handle around 1 million particles without chugging too much. However, it is barely using all the cpu cores. The simplest way to make things go faster is to distribute more work onto all the cpu cores. One way to do this is to let the workers do the pixel drawing as well. This is a trade off as to avoid workers writing to the same memory location we will need to give each worker their own pixel buffer to work off of. This means trading potentially more speed at the cost of more memory.
There are a few ways I could go about this. I ended up adding another giant SAB to hold the pixel data for each worker. This will mean a significant increase to the memory usage so I expect a decent speed up as part of the trade off.
let sabPixelBuffs = new SharedArrayBuffer(
  CPU_CORES * window.innerWidth * window.innerHeight * 3
);
I am storing only the RGB channels per pixel on the screen and I store a screens worth of pixels per worker.
The update to the render function is a little different as I need to accumulate the result from all the workers before drawing anything to the screen.
function render() {
  const width = canvas.width;
  const height = canvas.height;
  const pixels = backbuffer.data;
  const pixStride = width * height * 3;
  for (let i = 0; i < width * height; i++) {
    let r = 0,
      g = 0,
      b = 0;
    for (let j = 0; j < CPU_CORES; j++) {
      r += sabViewPixelBuffs[j * pixStride + i * 3];
      g += sabViewPixelBuffs[j * pixStride + i * 3 + 1];
      b += sabViewPixelBuffs[j * pixStride + i * 3 + 2];
    }
    pixels[i * 4] = r;
    pixels[i * 4 + 1] = g;
    pixels[i * 4 + 2] = b;
    pixels[i * 4 + 3] = 255;
  }
  context.putImageData(backbuffer, 0, 0);
}
The update to the worker is pretty simple. Just copy the old render code into the worker.
const buffStride = width * height * 3;
pixelBuffs.fill(0, buffStride * id, buffStride * id + width * height * 3);
for (let i = chunkOffset; i < chunkOffset + chunkSize; i++) {
  // simulation code
  if (x < 0 || x >= width) continue;
  if (y < 0 || y >= height) continue;
  const pixelIndex = ((y | 0) * width + (x | 0)) * 3;
  const rx = x / width;
  const ry = y / height;
  pixelBuffs[buffStride * id + pixelIndex] += 25 + 50 * rx;
  pixelBuffs[buffStride * id + pixelIndex + 1] += 25 + 50 * ry;
  pixelBuffs[buffStride * id + pixelIndex + 2] += 25 + 50 * (1 - rx);
}
Ok, great looks take a look at the results. WARNING flashing lights WARNING
Well….that is odd. It is flashing… but…like
why?
Remember earlier about multi threaded code? Remember how “usually” you can have multiple threads read the same data? Well after moving the render code into the worker….I left that “usual” bucket.
This is the offending line where I have broken the rule
pixelBuffs.fill(0, buffStride * id, buffStride * id + width * height * 3);
Before, the pixel buffer was cleared on the main thread right before the main thread draws. Now, the pixel buffer is cleared by the worker threads as the main thread is reading from the same pixel buffer. This is why the whole screen doesn't flash uniformly but only parts flash, the parts where a worker thread clears it's pixel buffer as the main thread reads the same pixel data.
To be clear, the previous code which rendered on the main thread was in fact reading stale data too. It was just a case where the staleness wasn't noticeable frame to frame and was thusly in the “usually ok” bucket.
Now, it isn't ok.
There are a few ways to fix this
- Use the Atomics api to sync reading and writing
- Use post messages to block rendering until the workers are done
- Implement double buffering at the cost of 2x pixel buffer memory.
Number 3 is interesting for unrelated reasons but I think it may be time to look at a better sync strategy.
The Fourth Pass
I want to block rendering until all the threads are done updating the simulation and building their respective pixel buffers. This can be done with messaging across the main thread and worker threads. I wanted to avoid using post messages as I find them to be a little awkward and it is harder to avoid garbage but better to worry about that after the flickering is fixed.
To do this I am going to drop the signaling array.
Instead the main thread will store an array of workers and how many are active.
const workerPool = [];
let activeWorkers = 0;
When a worker is done, it will post a message to the main thread which can update the number of active workers. When there are no active workers, the main thread will render and request another animation frame.
function onWorkerMessage() {
  activeWorkers--;
  if (activeWorkers !== 0) {
    return;
  }
  render();
  requestAnimationFrame(runSimulation);
}
Running the simulation now posts a message to let the workers know they can run another simulation step.
function runSimulation(currentTime) {
  const dt = Math.min(1, (currentTime - lastTime) / 1000);
  lastTime = currentTime;
  sabViewSimData[0] = dt;
  activeWorkers = WORKER_COUNT;
  workerPool.forEach((worker, i) => {
    worker.postMessage({});
  });
}
The rest of the main thread code is the same.
The worker code is generally the same but now a post message is used to signal the worker status rather than a signaling array.
self.postMessage({ id: SIGNAL_READY });
The result shows that the flickering issue is fixed.
I think it feels a bit smoother but better to look at the profiler and see what is happening.
Hmm….it is doing better in the main thread and the workers are doing significantly more work but the frame time did not get much better it even got worse. What gives?
The profiler has some answers
One difference is that the main thread is doing nothing while it waits for the workers to complete where as before it didn’t. If the workers didn’t wait for the main thread to render, it would shave ~7m off the frame time at 2m particles.
A common way to fix this which is built into most graphics drivers is to use something called double buffering. The idea is to have 2 pixel buffers instead of one and to swap between them each frame. While the main thread draws from one buffer, the workers can prepare the other buffer to be drawn. This means the workers can process the next simulation frame while the previous is being rendered.
Since I am already using far too much memory I thought it would be fun to just gobble up even more and implement double buffering.
The Fifth Pass
Ok, double buffering. The idea isn’t too complicated. Create 2 pixel buffers, swap which is active between frames and tell the workers to also swap buffers.
At this point I thought it a good idea to create a function which will handle resize events where the width and height change.
let sabViewPixelsA, sabViewPixelsB, activePixelBuff;
// other code
function resize() {
  canvas.width = window.innerWidth;
  canvas.height = window.innerHeight;
  sabViewSimData[4] = canvas.width;
  sabViewSimData[5] = canvas.height;
  backbuffer = new ImageData(canvas.width, canvas.height);
  sabViewPixelsA = new Uint8Array(
    new SharedArrayBuffer(width * height * 3 * WORKER_COUNT)
  );
  sabViewPixelsB = new Uint8Array(
    new SharedArrayBuffer(width * height * 3 * WORKER_COUNT)
  );
  activePixelBuff = sabViewPixelsB;
}
Only a slight change to the main thread code
let lastTime = 1;
function runSimulation(currentTime) {
  const dt = Math.min(1, (currentTime - lastTime) / 1000);
  lastTime = currentTime;
  sabViewSimData[0] = dt;
  activeWorkers = WORKER_COUNT;
  workerPool.forEach((worker, i) => {
    worker.postMessage({
      sabViewPixels: activePixelBuff,
    });
  });
  activePixelBuff =
    activePixelBuff === sabViewPixelsA ? sabViewPixelsB : sabViewPixelsA;
  render(activePixelBuff);
}
You could swap the buffers before or after you update the workers. It is up to you. I am swapping buffers after.
The worker code doesn't need a change. That is it for double buffering.
Time to take it for a spin.
Ok, it feels better than before. And the profiler does show that the workers are no longer waiting for the main thread to render. Before some frames took over 50ms to complete and now they are hitting much closer to 16ms.
Great.
But something has been nagging at me. If you look at the profiler, there are 3 lines of code which were always slow and moving them to workers has only spread the “slownest” to the workers.
pixelBuffs[buffStride * id + pixelIndex] += 25 + 50 * rx;
pixelBuffs[buffStride * id + pixelIndex + 1] += 25 + 50 * ry;
pixelBuffs[buffStride * id + pixelIndex + 2] += 25 + 50 * (1 - rx);
Why are they slow?
If you think about cpu caching and data access patterns, what you find is that while all the data is tightly packed and contagious, it isn't being accessed contiguously.
A pixel index is calculated based on a particle's x and y position along with the screen width. It only requires data from the particle array to compute which is tightly packed and contiguous. The width is a constant and doesn't change between particles.
const pixelIndex = (y | 0) * width + (x | 0);
The pixel index is based on the order of particles in the SAB which is not sorted based on the pixel index of a particle. This means the pixel index between each iteration in the loop will jump anywhere in the pixel buffer. That kind of access pattern is somewhat random which causes cache misses leaving the poor CPU waiting for data. But this is only an issue if both the particle and pixel data do not fit into the cache. If everything can fit into the cache, than it should be fine.
So, how much data is being used and can it fit in the cpu cache?
The formula to calculate this is screen width * screen height * bytes per pixel + bytes per particle * total particles / number of workers
This formula works as all the pixel data must be present for each worker but only a fraction of the particle data, the fraction the worker is assigned to.
Using an iphone for a reference gives
h2532 * w1170 * 3 + 16 * 2,000,000 / 5
This ends up being well over 15Mb which is way too big to fit in any level 1 CPU cache.
This is why those 3 lines are slow. They are the lines which cause cache thrashing. No good.
I played around with a few ideas to fix this even going as far to sort the particles by pixel order before rendering. I tried a version using the Atomics api too to see if that made a difference. It was extremely awkward due the usage of promises. And…sometimes it would crash…i never figured out why it would crash. I could have done something wrong but the fact it is based on promises is just so so gross.
This current version of the simulation takes about 4ms to run at 2m particles on a first gen M1 chip. Accessing the pixel data adds another another 3.5ms. Writing data to the pixel buffer adds another 7ms. The main thread takes about 8ms to paint but that happens concurrently with rendering.
Testing on my iphone this is able to keep 60 fps at 1 million particles. Awesome.
However, on my desktop with over 20 threads it runs….very slow. Less than 60fps. What?
The profiler showed the main thread was taking 30ms to render. This is because there are over 20 worker threads which means the main thread has to accumulate 20 pixel buffers per frame which is….alot of pixels. This can be fixed by setting a max on the number of worker threads but that seems like a step backwards.
I didn't know how to solve this nor the cache thrashing issue so I went back to the simulation itself.
I had a new idea for interactivity and I wanted to clean up a few things before any more optimizations.
The Sixth Pass
A while ago when I was last playing around with particles I found a cool effect where a particle would always be pulled back towards its starting position based on the inverse squared distance. All this means is that the further away from the starting point, the stronger the force is. The effect gives an interesting fluid like visual.
To get this to work the particles need 2 more numbers to hold their starting positions.
const particleStride = 6; // 4 floats x,y,dx,dy,sx,sy;
const particleByteStride = particleStride * 4; // 4 bytes per float
const sabViewParticles = new Float32Array(
  new SharedArrayBuffer(PARTICLE_COUNT * particleByteStride)
);
I did a little cleanup in the worker code with new force functions that required using a caching object to work around garbage creation. With the new force functions the change was small just 3 lines to apply a force back towards a particle's starting position.
forceSqr(sx, sy, x, y, 1);
dx += cacher.x * delta * 1;
dy += cacher.y * delta * 1;
Let's see if it worked.
Again, I highly suggest running this yourself because the compressed video REALLY doesn't do justice. You can try it here.
This is so much fun. It is like jello.
There are these swirls which look almost like crinkled up paper or cloth. It is almost like fluid waves but then also not.
javascript, I love it
I thought a bit about turning the particles into boids. This meant I would likely need a spatial acceleration structure of some kind. The simplest option would be a grid hmm… a grid…
And it hit me. I don't need to store a pixel buffer per worker. I just need a grid with the number of particles per pixel.
Time for another optimization pass
The Seventh Pass
Storing the number of particles at a given pixel will use 1/3 of the memory of storing rgb data. This doesn't solve the cache access pattern problem but it is a big memory reduction which means more data can fit in the cache.
This only works because the color information for a particle is baked into the x and y location rather than additional data per particle.
I decided to opt for letting all workers share the same particle count grid and rely on the magic of SharedArrayBuffers to sync worker access. I didn't notice any difference between a dedicated memory buffer per worker vs a single buffer with “magic” data syncing so I opted with a single buffer magically syncing. There could be some issues with a single buffer but I didn't see any. Idk.
It is important to do this as it will solve the issue of the render accumulation step on the main thread slowing down as worker count increases. This is solved by removing the need for the accumulation step all together. Big memory savings here not just in terms of what will fit in the cache but RAM too.
Now the cache formula is screen width * screen height + bytes per particle * total particles / number of workers
Using the same iphone reference gives
h2532 * w1170 + 16 * 2,000,000 / 5
Which is around 9.3Mb or about a 30% reduction. 9Mb is still too big to fit in a level 1 cache though.
The updated render function is back to being pretty simple. Iterate over the pixels and set the color based on the number of particles at the given location.
function render(grid) {
  const width = canvas.width;
  const height = canvas.height;
  const pixels = backbuffer.data;
  pixels.fill(0);
  for (let i = 0; i < width * height; i++) {
    const particleCount = grid[i];
    const y = Math.floor(i / width);
    const x = i % width;
    const rx = x / width;
    const ry = y / height;
    pixels[i * 4] = (25 + 35 * rx) * particleCount;
    pixels[i * 4 + 1] = (25 + 35 * ry) * particleCount;
    pixels[i * 4 + 2] = (25 + 35 * (1 - ry)) * particleCount;
    pixels[i * 4 + 3] = 255;
  }
  grid.fill(0);

  context.putImageData(backbuffer, 0, 0);
}
The change in worker code is simple too.
const start = particleOffsetStart;
const end = particleOffsetEnd;

for (let i = start; i < end; i++) {
  // do simulation code

  if (x < 0 || x >= width) continue;
  if (y < 0 || y >= height) continue;
  const pCountIndex = (y | 0) * width + (x | 0);
  activeGrid[pCountIndex]++;
}
This doesn't make much difference in performance unless the worker count is high. My desktop can now use all 24 threads. However, it still ends up being slower than my first gen M1 macbook air. What gives?
It turns out that the Apple Silicone chips have stupidly big L1 caches. Like chungus big. My desktop Ryzen 9 3900x has a massive 64Mb L3 cache but the L1 is just 64kb. The first gen M1 chip has an L1 cache of 320kb. 128kbs are used for data and 192kbs are for instructions. My guess is this unusually large L1 cache has to do with requirements for Rosetta 2 to work as well as it did but I could be wrong.
This does help explain why the M1 is faster than my big desktop Ryzen 9. It has a bigger data cache and doesn't have to wait around as often for memory to move between the cache and RAM.
False Conclusion
When the dust settles all the optimizations yielded around a 2x speed boost compared to the first multi-threaded version. I was able to hit 1 million particles with the cpu on a phone at 60 fps. A decent result given it is all javascript but not particularly impressive. I'd expect a compiled language to be 10x faster and assuming it can use SIMD instructions in the tight loops it should get even faster than that.
I don't think I can close this all out without whipping up a quick comparison example using a more traditional GPU instancing technique for rendering rather than a janky custom rasterizer. So the simulation remains on the CPU but rendering will utilize a standard GPU based pipeline.
20,000,000 particles
I put together a basic example which uses threejs and GPU instancing of a plane/quad for rendering the particles. It actually performs a bit worse than you would think. Instancing with threejs requires an updated matrix for each particle position which is done on the CPU on a single thread. This work could be distributed to the GPU or across all CPU cores but it would still be slow.
This is because the particle transform data must be uploaded to the GPU on every frame and this is pretty slow. For example, simulating 4m particles on my M1 chip ends up spending 80% of the frametime sending data to the gpu. On my desktop it spends only 30% of the time sending data but data transfer is still the biggest bottleneck. Once the GPU has the data, drawing remains pretty fast. This means as the particle count increases so does the amount of data sent to the gpu which does not scale well past a few million particles. There is a pretty simple optimization though.
I figured I could use the same particle grid count from before as a texture and render a full screen quad rather than instanced points. The idea is to make it so data transferred to the gpu per frame is fixed and not based on simulation size. Using the particle grid count from before fixes the data transfer per frame to the screen resolution. While this will send less data for large simulations more data is sent for small simulations. It is a trade off in favor of larger simulations, a trade off I am happy to make.
I implemented a quick version in threejs with a custom pixel shader. I was surprised with the result. The main thread takes only a few ms to render regardless of the simulation size. This frees up the workers to run as fast as they can. Now the simulation is directly bound by the number of CPU cores at both large and small scales. Each worker spends about 50% of the time crunching numbers and 50% updating the particle grid counts. It could be possible to speed up either side but I don't have any ideas outside of micro optimizations.
This version can hit 20m particles on on M1 mac at around 20fps on battery life. That is pretty crazy for pure javascript. My desktop can do about 30m at the same fps. I asked a friend who had a 32 core CPU to test it and they hit about 40m which is almost enough to fill five 4k displays. The scaling is pretty decent as you add more cores. You can give 20m a spin here. You can also play around on your phone at a more modest 1m here.
What is the take away here?
CPUs and GPUs can crunch numbers fast. Like really really fast. Moving data around is slow and even slower when accessing data randomly. If you want to go fast, it is good to know how hardware works.
I enjoyed the hell out of this little journey into web workers and SharedArrayBuffers. SharedArrays are kinda like magic to me with their “eventual visibility”. Once webgpu is a little more well adopted I will take a stab into compute shaders.
Until next time, have a wonderful day.