How to save $13.27 on your sAAs bill
I decided to try out Vercel's analytics product on a newly minted pro plan, it included some 25k events.
You see, I had to start paying Vercel $ as more than 20 people visited my website. I had been using massive png images on a few high traffic pages which ate up my free outbound data. This is because the default format of taking a snippet on a Mac is a png. It is also because I didn't want to pay Vercel to make all 12 of my website's images go fast. I figured it wouldn't matter. I don't get much traffic.
Fast forward 4 years.
Well it did matter. And here I sit looking the fool as I humbly type my CC info into Vercel's payment form. How did I solve the issue? Did I integrate Vercel's images? Did I use an alternative cdn? No, I just converted the 2 worst offenders to jpgs and rewarded myself with another sip of coffee for a job well done. Clearly a decision the past me from four years ago would approve of.
I read Vercel's analytics marketing and pricing pages. 25k events are included with pro and $14 per 100k after. Seems pricey but I can cancel if I use up my quota. All good. Let's implement it.
I have used google, datadog, segment, and a few other client side offerings and came with expectations. It should be easy to implement and Vercel delivered. It took two lines of code since this is an older vercel project that used both the app and page routers.
<Analytics />
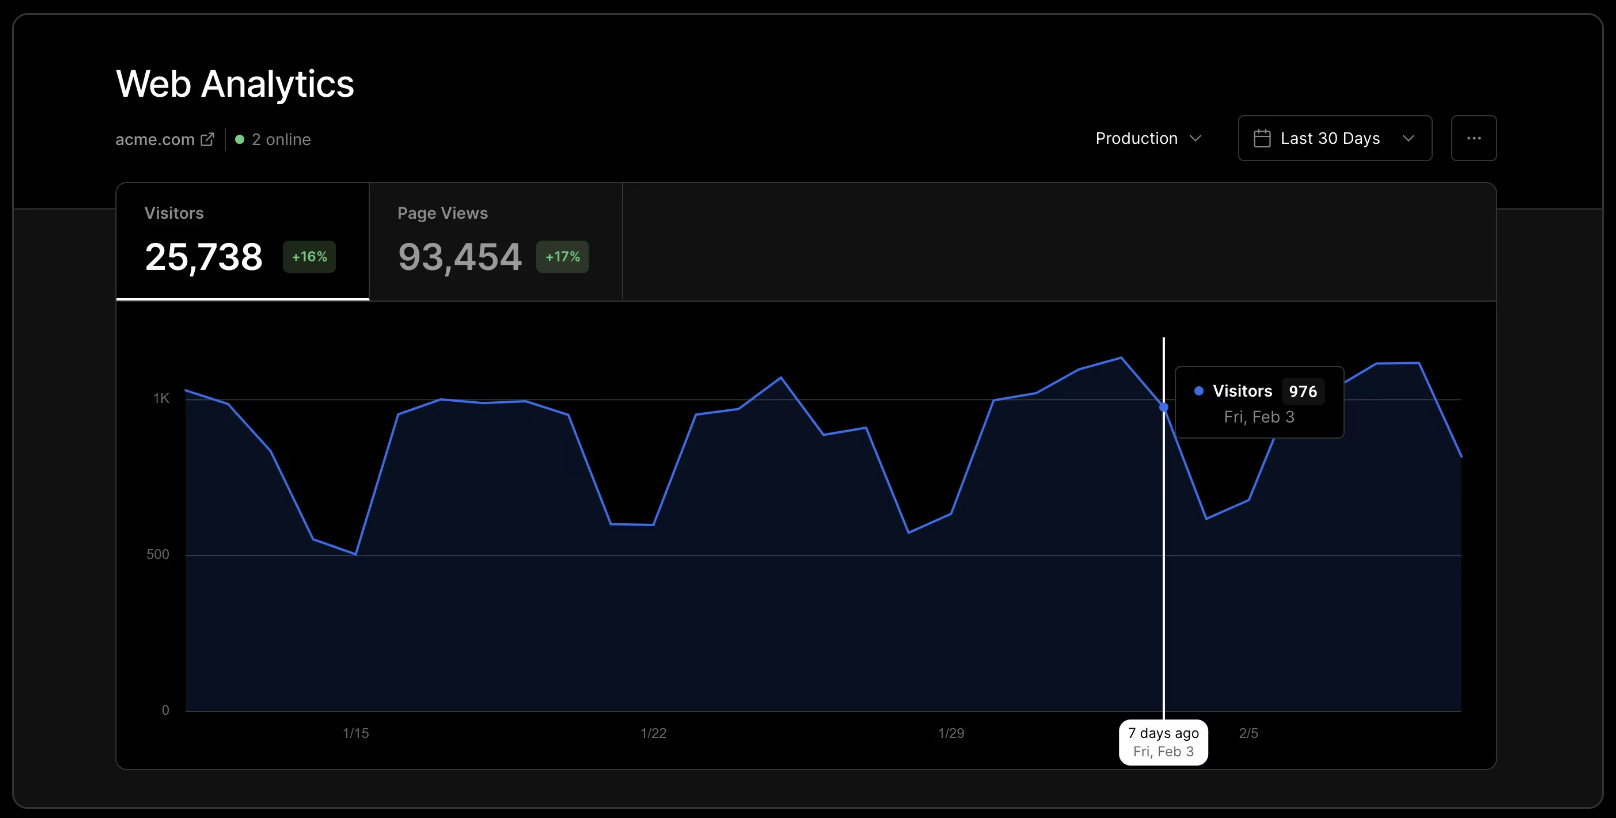
With a push to production it is live. Nice. I think it took all of 60 seconds. The dashboard view is decent. It has about what I am looking for. Popular urls, total visiters, browsers, country, all good stuff. There is some additional depth I'd like to see but it lives behind a prestigious super pro analytics tier that costs even more. That is ok though. The traffic is barely eating into the 25k quota though so I am happy. Good stuff.
1 week later

You can guess where this went. No, not a big bill. Only $28. Surely though. Surely!!! There has to be a better way. And no, I am not thinking of the latest trending analytics sAAs vendor nor the resident OSS tool's managed cloud offering from the project's maintainers.
I live on the edge, the edge of the network, the browser, the bleeding edge. Everything must be serverless, multi-region, edge delivered, eventually consistent, strongly typed, ACID compliant, point in time recovery, buzzword buzzword, and buzzword bazzword. In the noise, if one listens closely, an echo can be heard. Old backend engineers from long long ago in the before time whisper of sacrilege. They use words like "htmx", "monolith", and "OOP". Usually I ignore the whispers like we do but one word kept coming up. It stayed with me. Day after day. Month after month. Taunting me. "sqlite".
We have been spoiled by the Vercel's of the world, the heroku's too, and even dare I say, the Salesforces. My infra game is weak. I thought it would be a fun challenge and good practice to try and save a few $ on my Vercy bill by building an analytics api from scratch using a new stack. A stack so bleeding edge that the edge lords have only just now heard of it.
the squeeh stack
The Squeeh stack is a new stack I just created 15 seconds ago. What is the Squeeh stack you ask? Well I am glad you asked. Any app which uses sqlite for data counts as a Squeeh Stacktm.
- flask + sqlite + psql? squeeh stack!
- node + sqlite + hono + cloudflare? squeeh stack!!!
- unity + sqlite? squeeh snack!
- swift + tim apple + sqlite? yup also squeeh stack!
Sqlite may be the worst possible option for an analytics service but I keep hearing people saying it is fast. I have never used it though. People on the internet are generally a trustworthy bunch so I am going to trust them and use it. I am going to use bun and hono as the api layer. Bun because it has a delicious looking mascot and Hono because I saw this video where a guy said Hono and it made me laugh. I don't know why. I had never heard of Hono until then.
It didn't take long to get an api setup locally. A simple schema with a db.ts script creates the table. I am skipping migrations and other data best practices. No daily backups, snapshots, point in time recovery. Capturing the data is more important at this point.
app.post("/analytics", async (c) => {
  try {
    const data = await c.req.json();
    insertLog(data);
    return c.json({ message: "Event logged" }, 201);
  } catch (error) {
    console.error("Error logging analytics:", error);
    return c.json({ error: "Internal Server Error" }, 500);
  }
});
It is time to get a gut check on how much sqlite could handle before continuing. It isn't that I don't trust the internet but you know, better to check now.
Gypity gave a pretty simple load test script using hey. I removed the useless comments and ran it.
URL="http://localhost:3000/analytics"
DURATION="30s"
CONCURRENT_REQUESTS=10
TOTAL_REQUESTS=10000

DATA='{
  "time": "2024-07-23T15:12:20.53Z",
  "status_code": 200,
  "status_text": "OK",
  "host": "example.com",
  "request_path": "/some/path",
  "request_id": "abc123",
  "request_user_agent": "Mozilla/5.0 (Windows NT 10.0; Win64; x64) AppleWebKit/537.36 (KHTML, like Gecko) Chrome/91.0.4472.124 Safari/537.36",
  "level": "Info",
  "environment": "production",
  "location": "New York, USA",
  "ip_address": "203.0.113.1"
}'

hey -m POST -d "$DATA" -H "Content-Type: application/json" -c $CONCURRENT_REQUESTS -n $TOTAL_REQUESTS $URL
The first test ran fine.
Summary:
  Total:        0.4716 secs
  Slowest:      0.0220 secs
  Fastest:      0.0000 secs
  Average:      0.0005 secs
  Requests/sec: 21204.8583

  Total data:   260000 bytes
  Size/request: 26 bytes
  ---------------------
I have no idea if that is a good result. Better bump it up to 1m requests and see how it does. I will also start another process running some reads against the same file to see what happens there.
And I get some locks and a few dozen failed requests. Adding the WAL pragma seems to fix the locking issue.
db.exec("PRAGMA journal_mode = WAL;");
Now that I am thoroughly distracted from the original goal time to fixate on making this number go up. I could buy a more powerful computer but batching the inserts would be cheaper. I wrote a function to do this for me.
const insertAnalytics = db.prepare(`
  INSERT INTO analytics (
    data
  ) VALUES (many question marks)
`);

const transact = db.transaction((logs) => {
  for (const log of logs) {
    insertAnalytics.run(...orderSpecificLogFields);
  }
  return logs.length;
});
To gather the events before a batch I kept it stupid simple.
let activeLogBuffer: any[] = [];
let isActiveWrite = false;

function backgroundPersist() {
  if (activeLogBuffer.length === 0 || isActiveWrite) return;
  try {
    const tempLogs = activeLogBuffer;
    activeLogBuffer = [];
    isActiveWrite = true;
    const count = transact(tempLogs);
    console.log(`inserted ${count} events`);
  } catch (e) {
    console.error("batch insert error events dropped", e);
  }
  isActiveWrite = false;
}

setInterval(backgroundPersist, 20);

app.post("/analytics", async (c) => {
  try {
    const data = await c.req.json();
    activeLogBuffer.push(data);
    return c.json({ message: "Event logged" }, 201);
  } catch (error) {
    console.error("Error logging analytics:", error);
    return c.json({ error: "Internal Server Error" }, 500);
  }
});
This is great as I can also return a response before the event persists which will prevent blocking until the write completes. I think it is a great idea to take a cue from frontend land and optimistically return an "Event logged" response even though the event has not yet been logged. Let's load test 100k with a few random read queries in another process.
Summary:
  Total:        2.0621 secs
  Slowest:      0.0093 secs
  Fastest:      0.0000 secs
  Average:      0.0002 secs
  Requests/sec: 48495.3401

  Total data:   2600000 bytes
  Size/request: 26 bytes
And what about 1m with 20 concurrent requests.
Summary:
  Total:        19.8167 secs
  Slowest:      0.0111 secs
  Fastest:      0.0000 secs
  Average:      0.0004 secs
  Requests/sec: 50462.3789

  Total data:   26000000 bytes
  Size/request: 26 bytes
There is a pragma to keep the db in-memory but it didn't seem to make a difference. I also read about how I could include more records per prepared statement which should help a bit more. I have been distracted long enough. This works fine.
Time to deploy it.
how to get kicked off the ocean
The api service is stupid simple, getting that api inside a docker container was not. I made the rookie mistake of having skill issues with docker. I tried to a get fancy docker compose file going and I did but it took way too long. I picked DigitalOcean for a VPS host and my expectations were high. While it is possible to have a docklet spin up based on an image pulled from a registry when an action is fired like a merge request, it is also involved. It is even more involved to get a zero downtime deployment going without dipping into more complicated orchestration.
I ended up ditching docker and running everything bare metal. I ssh'd into my VPS and got to work dusting off my admin skills. As I made config changes I built a bash script which should do everything needed to spin up the service on a new machine. Install all the dep, configure nginx with lets encrypt, etc. This took me a long time to do. It's not hard, just more skill issues. This made deploying changes much easier down the road.
After confirming I could access the remote api I figured I should load test it. I ran the same script and only hit some 250 req/s. I knew something was off though as the cpu and memory barely moved. I ran it again and it started to just hang. The VPS wasn't doing anything. The bun process was still running with no issues. I thought maybe I didn't provision enough compute so I bumped up to double the ram and a better processor. I ran the load test again and hit 2k req/s before hanging. The cpu and memory ticked up ever so slightly but then dropped down.
It turns out digital ocean blocked my ip. I can no longer directly ssh in. I have to use the console window from digital ocean's dashboard. To confirm this I had a friend run my same load test and he too was blocked from accessing that particular ip. Hilarious and it does work. I don't know how well but nothing like throwing some live traffic at it.
a poor mans analytics
The api will sit behind a function on Vercel. There isn't any auth on the endpoint so I'd rather obfuscate it a bit. I am also going to try and include a bit more information and implement some simple session tracking so I can get a better idea of unique users. Ip address could be used but I want something which will be more reliable. Cookies come to mind but I think an id in localstorage is better. This is the schema I needed to populate.
db.exec(`
  CREATE TABLE IF NOT EXISTS analytics (
    id INTEGER PRIMARY KEY AUTOINCREMENT,
    type TEXT,
    time TEXT,
    status_code INTEGER,
    status_text TEXT,
    host TEXT,
    request_path TEXT,
    request_id TEXT,
    request_user_agent TEXT,
    session_id TEXT,
    os TEXT,
    browser TEXT,
    country TEXT,
    level TEXT,
    environment TEXT,
    location TEXT,
    ip_address TEXT,
    content TEXT,
    referrer TEXT
  )
`);
Storing a few derived fields from the user agent will make grouping by them much easier. Most of the fields are pretty simple to populate but location/country were trickier. I know that geo information can be included based on ip. To do this you have to setup a local ip lookup db which must be updated every month based on a vendor who kinda has a monopoly in the space. The lookup process can add some overhead. Vercel is suppose to populate the geo field on edge requests. I don't know why but my website doesn't run in the edge runtime. I decided to skip the geo lookup step. I can always add an ip lookup later on and run a backfill.
Here is the Vercel function.
import { UAParser } from "ua-parser-js";

const url = process.env.ANALYTICS_API_URL || "fallback";

export async function POST(req) {
  const data = {
    ...requestData,
    //set other data from headers etc
  };

  try {
    const response = await fetch(url, {
      method: "POST",
      headers: {
        "Content-Type": "application/json",
      },
      body: JSON.stringify(data),
    });

    const result = await response.json();
    return new Response(JSON.stringify(result), {
      status: 201,
      headers: {
        "Content-Type": "application/json",
      },
    });
  } catch (error) {
    // handle errors
  }
}
I did want some idea of a country breakdown so I pulled it off the language settings in the browser.
And here is the react hook for that.
import { usePathname } from "next/navigation";
import { useEffect } from "react";

function getSessionId() {
  let sessionId = localStorage.getItem("sessionId");
  if (!sessionId) {
    sessionId = `session-${crypto.randomUUID()}`;
    localStorage.setItem("sessionId", sessionId);
  }

  return sessionId;
}

export const useAnalytics = () => {
  const pathname = usePathname();

  useEffect(() => {
    const logAnalytics = async () => {
      const country = navigator.language.split("-")?.[1] || "Unknown";
      const data = {
        status_code: 200,
        status_text: "OK",
        request_path: window.location.pathname,
        session_id: getSessionId(),
        referrer: document.referrer,
        type: "page-view",
        country,
      };

      try {
        await fetch("/api/analytics", {
          method: "POST",
          headers: {
            "Content-Type": "application/json",
          },
          body: JSON.stringify(data),
        });
      } catch (error) {
        console.error("Error logging analytics:", error);
      }
    };

    logAnalytics();
  }, [pathname]);

  return null;
};
While this does work and will get the job done. I added support for navigator.sendBeacon, page-leave, and page-return events. It was tricky to get cross browser support since I listen for multiple sources of a "session end" event and didn't want to double count. A useRef can solve this. If navigator.sendBeacon is not supported, a fetch request is used as a fallback.
const pathname = usePathname();
const hasFiredExitEventRef = useRef<boolean>(false);

useEffect(() => {
  logAnalytics("page-view");

  const handleVisibilityChange = (e: any) => {
    if (document.visibilityState === "visible") {
      logAnalytics("page-return");
      hasFiredExitEventRef.current = false;
      return;
    }

    if (hasFiredExitEventRef.current) return;

    if (document.visibilityState === "hidden") {
      logAnalytics("page-leave");
      hasFiredExitEventRef.current = true;
      return;
    }

    if (e.type === "pagehide") {
      logAnalytics("page-leave");
      hasFiredExitEventRef.current = true;
    }
  };

  document.addEventListener("visibilitychange", handleVisibilityChange);
  window.addEventListener("pagehide", handleVisibilityChange);

  return () => {
    document.removeEventListener("visibilitychange", handleVisibilityChange);
    window.removeEventListener("pagehide", handleVisibilityChange);
  };
}, [pathname]);
Naturally this hook must live only on the client so I will perform what I call "client component boxing" a common pattern in the new RSC world.
"use client";
import { useAnalytics } from "./useAnalytics";

export function Analytics() {
  useAnalytics();
  return null;
}
Tell me this pattern isn't hilarious without it being hilarious. Adding it to the app is as easy as Vercel's so DX is the same.
import { Analytics } from "./components/Analytics";
import { Analytics as VercelStyle } from "@vercel/analytics/react";

export default async function RootLayout({
  children,
}: {
  children: React.ReactNode;
}) {
  return (
    <html lang="en">
      <body>
        {children}
        <Analytics />
        <VercelStyle />
      </body>
    </html>
  );
}
Vercel will stay running as I need a baseline to compare against. I almost pushed to main, as is the way, but decided to test it out in a branch instead. Usually everything I write works the first time as is tradition but I had a sneaky suspicion i didn't really know what I was doing. I deployed to a preview branch and started clicking around. I ran a query against the db file on my VPS and it was working. First try? Wow! That uhh...usually doesn't happen.
Rewarding myself with another sip of coffee I pushed it off to production.
500 is the new green
The next day I see a wall of red with sprinklings of green. 500s. Streams and streams of them. This is fine. I ssh into the vps and of course the bun process isn't running. There are no spikes in cpu, disk, memory, the service just stopped. But why?
I don't know but the solution was obvious. Find the root cause? No. Add orchestration with self healing hyper nano pods? Closer. It was systemd. I'd love to say I started at systmed but I actually noodled about with some node tooling first. The fact I forgot systemd existed is how I knew it was the right choice. It is even more embarrassing that gypity was the one who suggested it.
I settled on this config file. I updated the setup script to include registering this on the system.
[Unit]
Description=Monolith Server
After=network.target

[Service]
ExecStart=/root/.bun/bin/bun /root/squeeh-stack/app/src/index.ts
WorkingDirectory=/root/squeeh-stack/app
StandardOutput=append:/var/log/monolith-server/out.log
StandardError=append:/var/log/monolith-server/err.log
Restart=always
User=notRoot
Environment=NODE_ENV=production
Type=simple
RestartSec=3

[Install]
WantedBy=multi-user.target
I spun a bit trying to get this to work right. I thought I had a config wrong as the process kept crashing and restarting until it exhausted the default restart count. It turns out the db changed but I forgot to recreate it. Logs are great.
The red 500s are now all green. Overtime you can see when bun crashes and restarts. I am open to ideas on why this happens but my guess is because bun isn't written in rust.
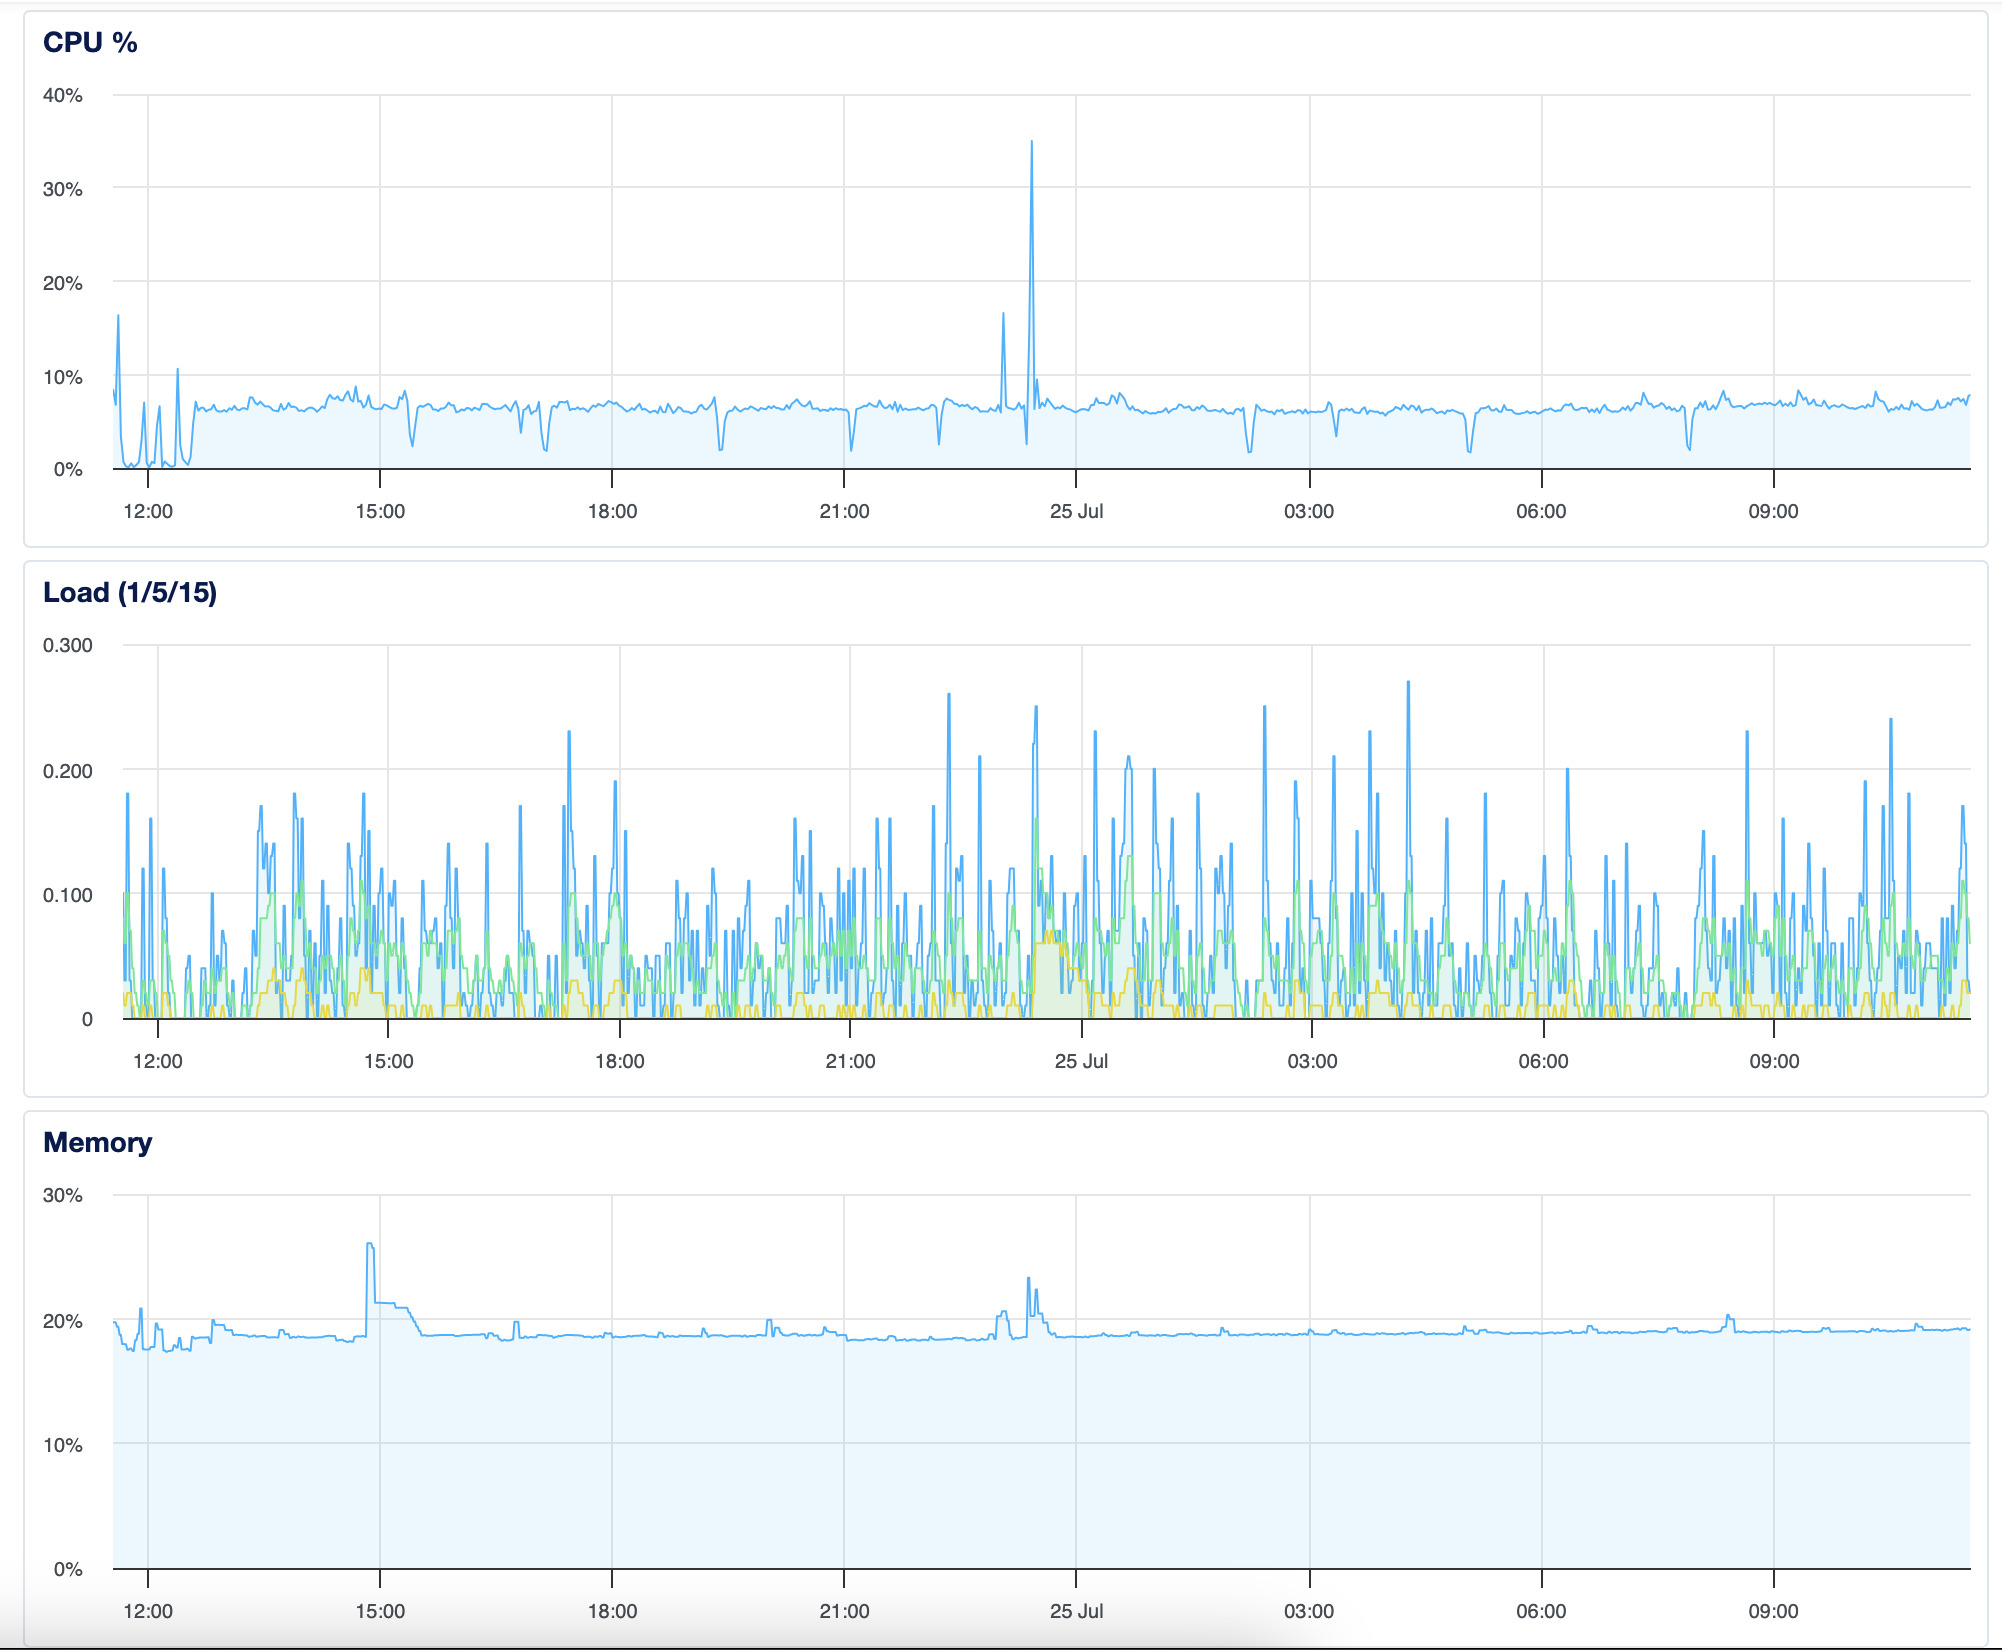
You thought that was funny right? Because bun is written in zig and rust is clearly superior in every way. Well it wasn't bun, it was Hono the whole time. I looked in the systemd logs after a day and noticed that Hono's static router was crashing on some weird uri error.
return async (c, next) => {
if (c.finalized) {
await next (); return;
let filename = options.path ?? decodeURI(c.reg•path) ;
URIError: URI error
stack ->>>
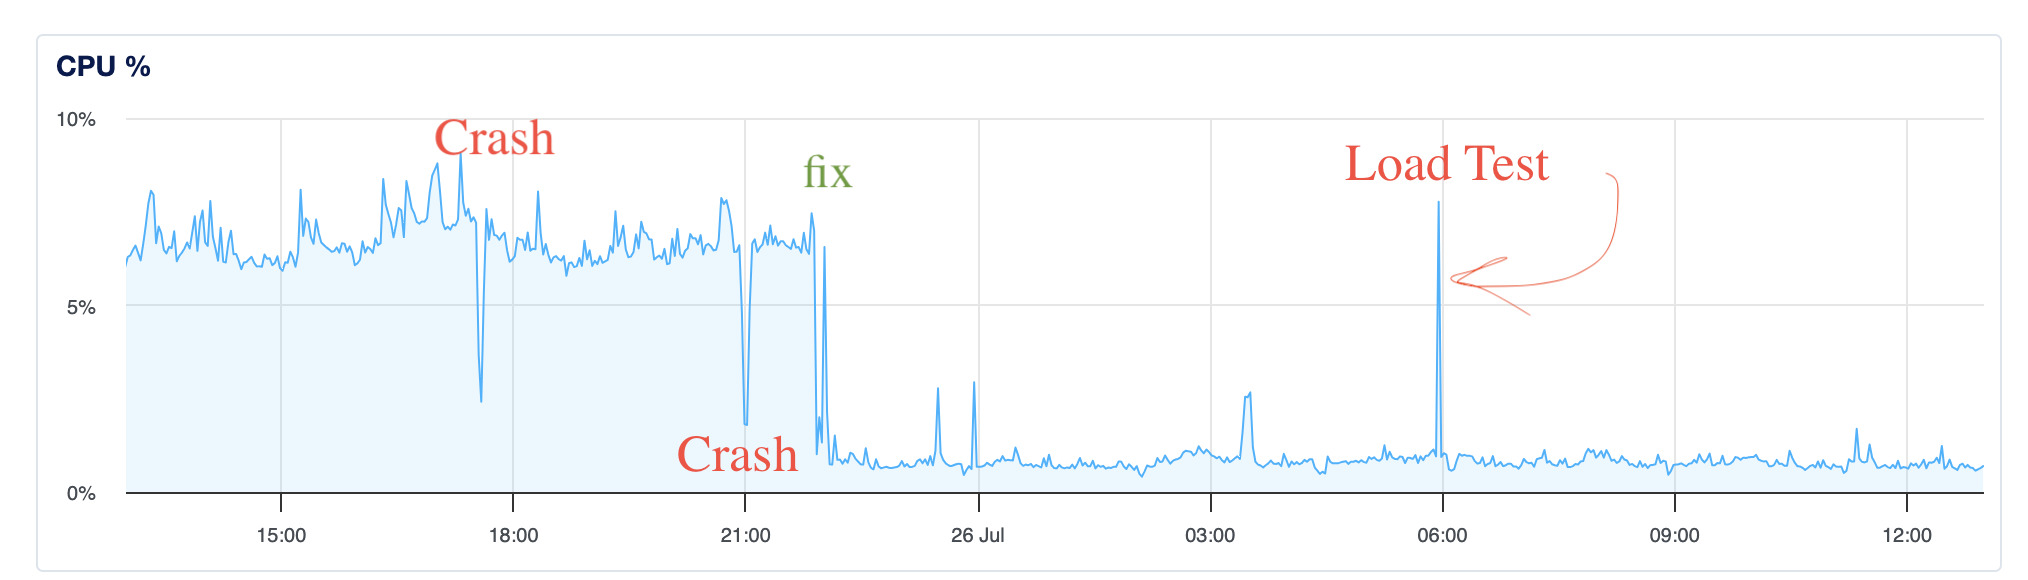
I don't know why I added a static router but when I removed it, not only did it stop crashing, it decreased the baseline cpu usage significantly. While it would be easy to say, "bad hono, no, that's a bad Hono!". It is possible I was doing something wrong, either way, this chart makes me happy.
Ok, time for some analytics.
analytics 101
I wrote out the analytics features based on what Vercel has. I figured the bare minimum would be to match what they offer. I added a few more and send it off to gyptiy to write a bash script which would create a markdown file with this info. I wanted it to also email me but I knew I was already pushing it. It wasn't a usable result. Instead, I asked it to give me a js function which returns the query results.
prompt

schema

metrics

unique visitors based on session id group by page, referrer, country, os, and browser
total unique visitors based on session id
total page views
unique visters change trend since last date range
page views change trend since last date range
average time spend on website
bounce rate for top 20 pages.
It got a little more than half right. A better ratio than the liveliness of my analytics service. I added an endpoint to return some json with metrics I could look at.
app.get("/analytics/metrics", async (c) => {
  try {
    const metrics = await getAnalyticsMetrics(db);
    return c.json(metrics);
  } catch (error) {
    console.error("Error logging analytics:", error);
    return c.json({ error: "Internal Server Error" }, 500);
  }
});
And it works.
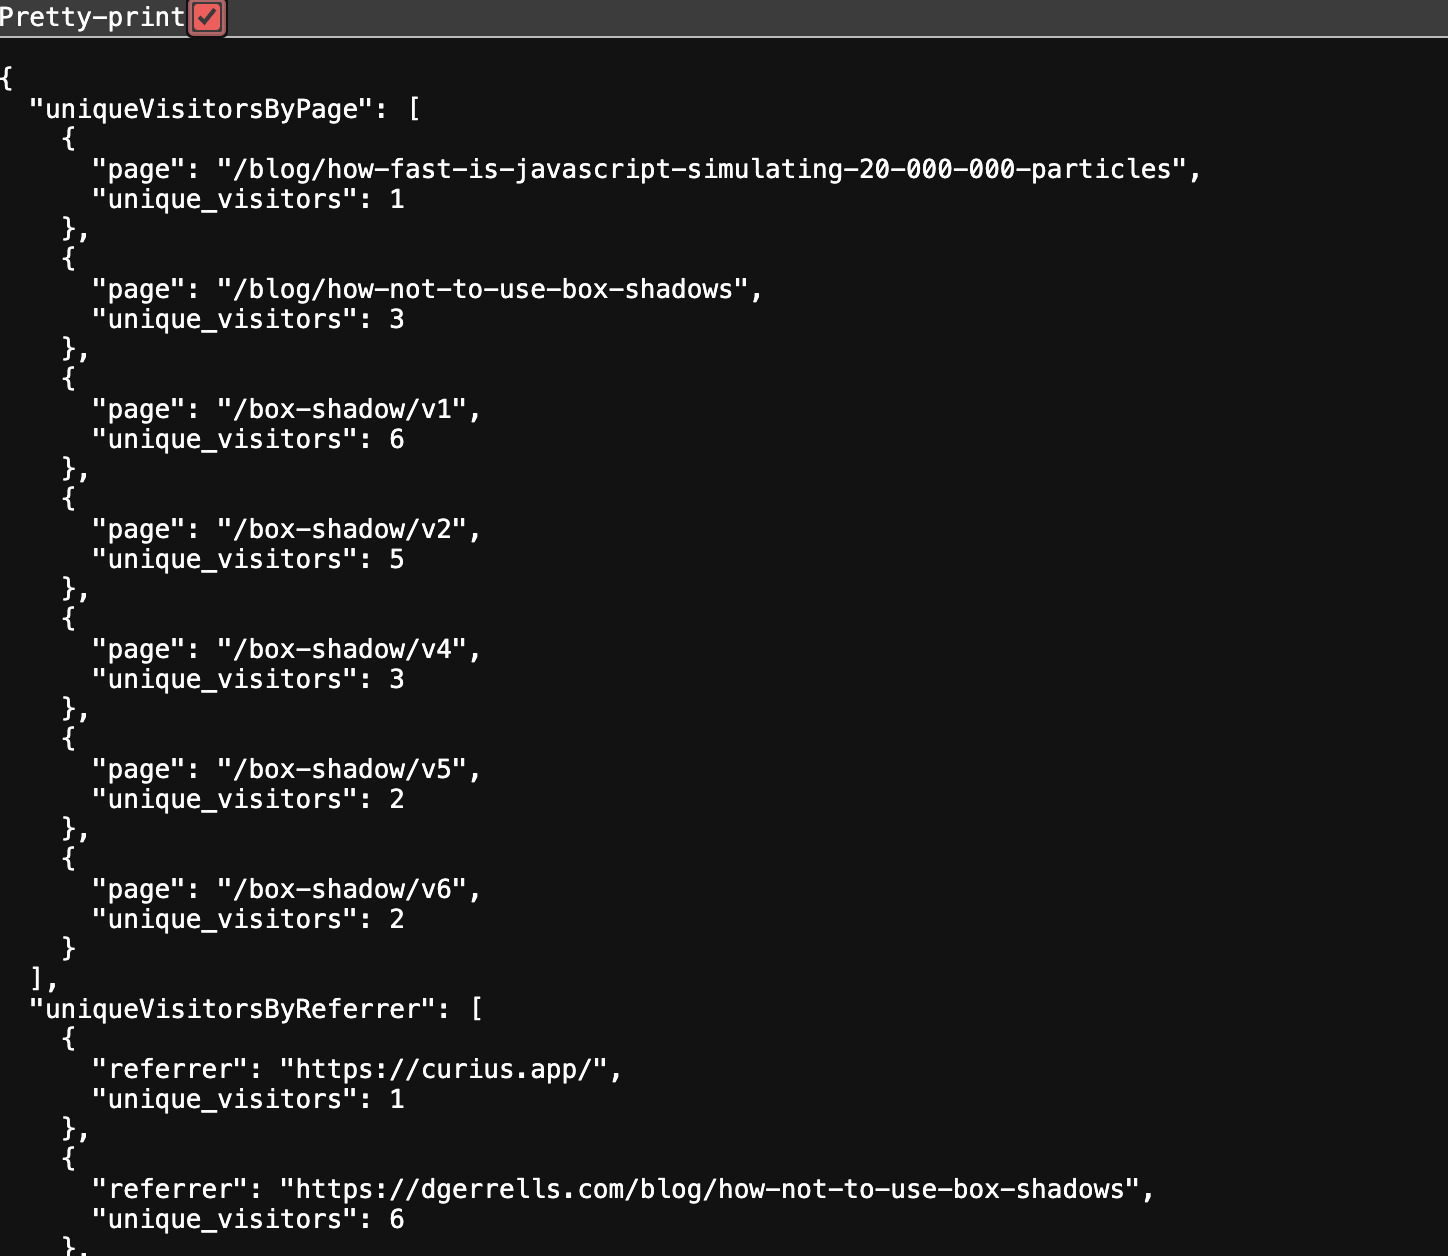
I keep reeding about how great gypity is at building UI products from the internet. I gave it my analytics json file and it spit out some react charts using rechart. I don't know rechart but the code looked simple enough. I plugged it in to nextjs and get an error I have never seen before.
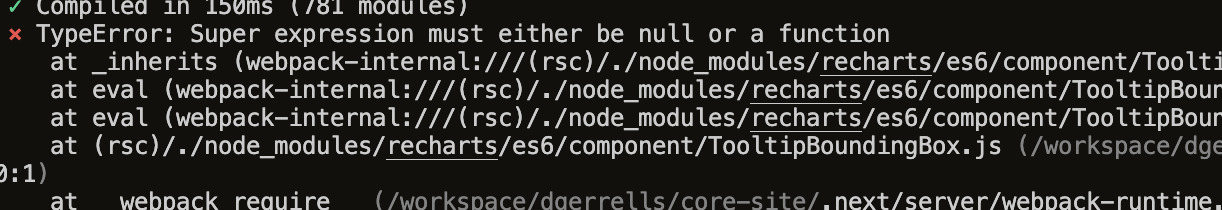
Research found that it is an error from back in the long ago times of class based react components. And sure enough the rechart library has class components. I "client component boxed" the rechart component and the error went away but the code didn't work either. Looks like rechart doesn't like RSC.
I asked gypity to try again and it picked nivo this time. I have heard of nivo it has pretty charts but I have never used it. Gyptiy wrote well over 1k lines of code for this one. I plugged the code in and got an error I was familiar with.
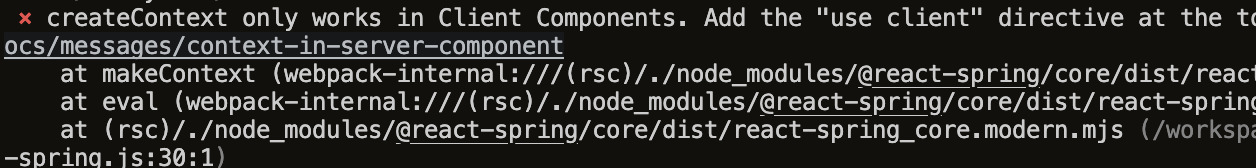
It seems a context is used by the charts and RSC don't like those. Clearly nivo is an old and unsuitable library if it doesn't support RSC. I would add the latest shaddy chart library but I don't have tailwind setup. Instead I will drop the charts and opt for a simpler approach. More pure and soulful. Plain old html tables with css frosting.
This is the result.
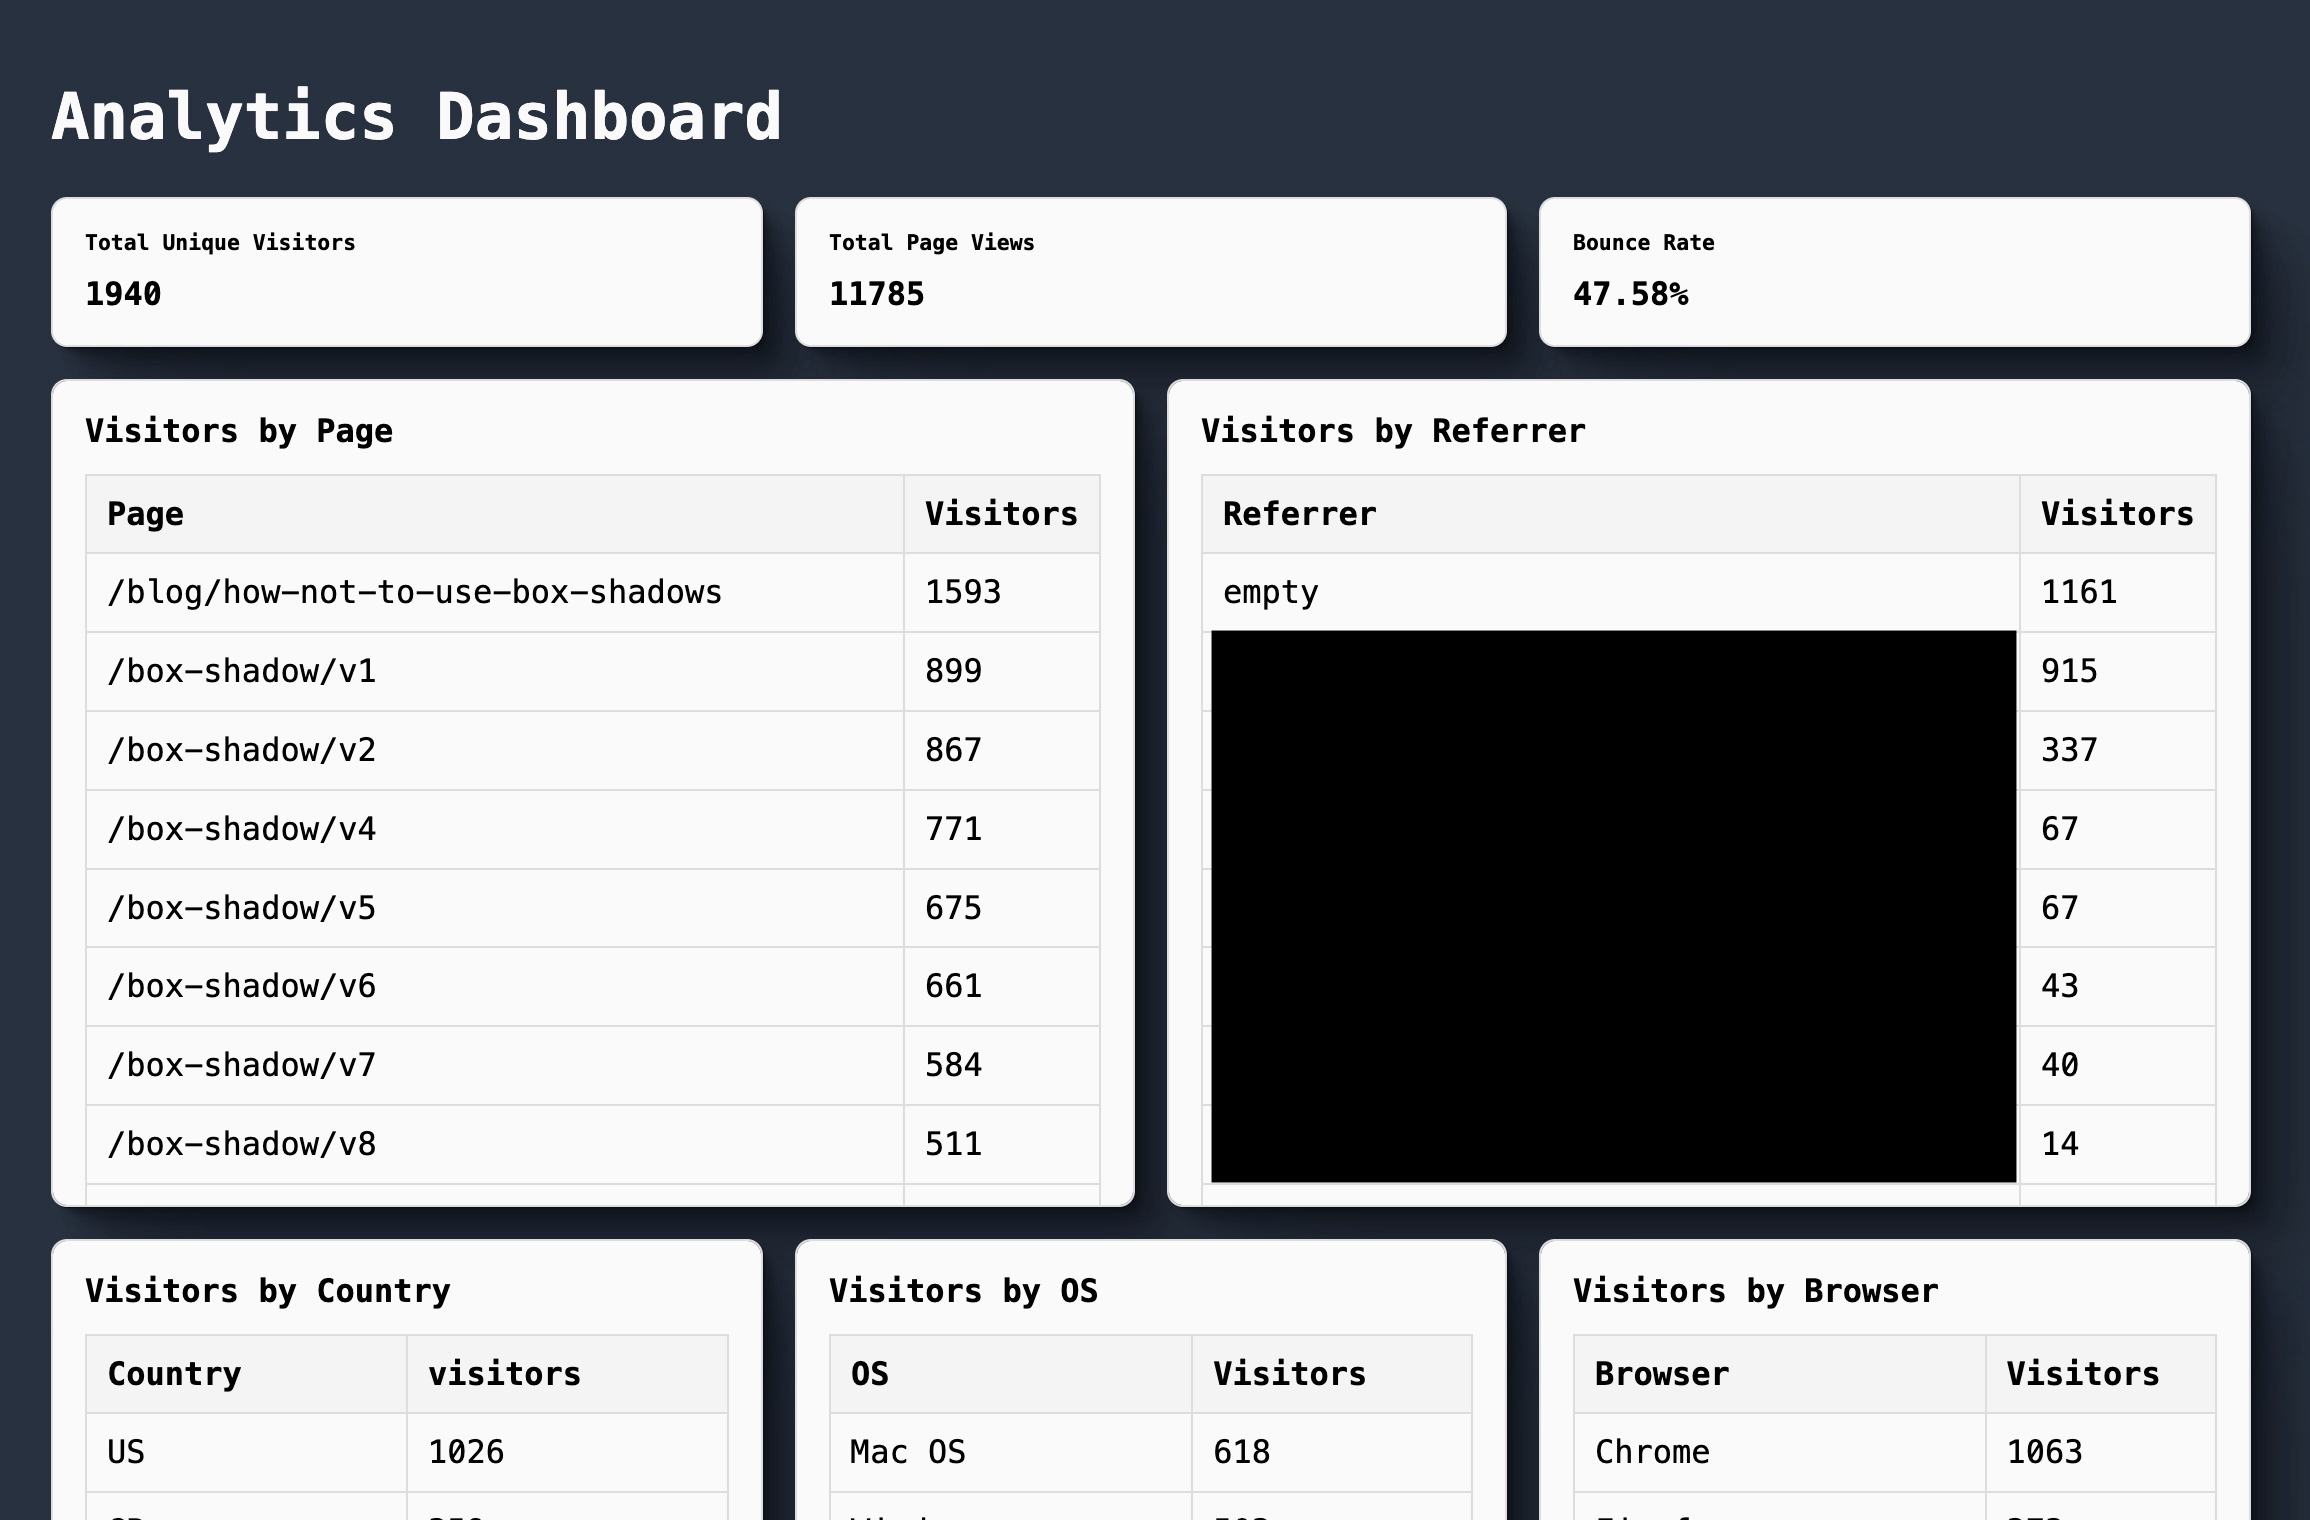
I hate it but also find it endearing in an ugly duckling kind of way. I do have other data I could display like daily/weekly trends and could allow drilling down to individual sessions.
This is fine for now...
dashboard round two
It wasn't fine at all. That dashboard sucked. I changed some styles and flavor a bit and trimmed down superfluous information. I picked apart Vercel's dashboard design beyond the layout for inspiration. It is subtle in how simple it is to use. I like a bit more information thrown in my face personally but it got me thinking.
I tried to use ye'old gyptiy, sonnyte, and v0 to make a chart component for me. None were up to the task. Everything either didn't work or looked terrible. No libraries allowed here.
I hacked together a chart component with the following api.
<BoxChart
  title="Your a wizard harry"
  data={[
    {
      label: "date",
      value: 42,
    },
  ]}
  height={300}
/>
It is put together with a bunch of divs and some flex box glue. It kinda works on mobile too but needs more polish.
Here is the new dashboard featuring the chart.
I like it. Here is a chart with live version with some data.
big data energy
With that out of the way it is time to look at the baseline.
squeeh-stack vs Vercel
The data when compared to Vercel is a pretty close match. My analytics seem to over count a bit compared to Vercel which could be how uniqueness is determined. I also don't filter out testing nor bot data. I did notice that Vercel's tracking gets blocked by default even with shields down on Brave where as mine is not. The data analytics people may bulk at the potential of over counting here but I just consider it a feature. Nothing helps juice up a company's valuation like inflated metrics.
Looking at language seems to give a good baseline when compared to Vercel's analytics which uses the ip. It is pretty close to accurate although someone in Dublin will show up as GB. I did find out that Vercel does populate the geo info. Some docs said to look at the geo object on the request where as in reality it is in a header.
const country = headers.get("x-vercel-ip-country") || "Unknown";
const city = headers.get("x-vercel-ip-city") || "Unknown";
const location = `${country}, ${city}`;
With the current traffic this would run fine on a $6/m VPS. Data is enough to cover well over 100m events maybe even a billion depending on sqlite. I can add volumes for data backup for a few bucks more depending on size. I left the VPS over provisioned at a higher tier and came out to a $13.27 savings compared to my current Vercel Analytics spend. It took about 2 days to build this and reap those sweet sweet savings. CPU/Memory/etc is low. When load testing bun peaked at around 50mb. Pretty fat when compared to others but still significantly cheaper.
There is freedom to add additional analytics and queries since I have direct access to the service and data. For example I am able to get a bounce rate approximation. With a little more work I can get an average visit duration among others. I imagine Vercel has more features but behind a higher paywall.
An engineer who doesn't suffer from infra skill issues could spin up a much more robust and stable analytics service in a fraction of the time. However, for each additional "robustness" feature added, the cost and complexity will go up too. If I wanted zero downtime deployments, that means orchestration with additional provisioning. If I wanted data guarantees, that'd add even more.
I am going to keep running this along side Vercel to see how it does and will iterate on it overtime. Who knows, maybe I'll spin up a sAAs product which is nothing more than a droplet wrapper with a sqlite database slapped in. I better slap AI in the domain to make sure people know I mean business.
shush, I know of turso. They look amazing.
fin
This was fun and outside my comfort zone. I want to do more to see what a squeeh stack can handle. I have ideas.
Cheers!
One final note. I know that Vercel is wrapping Tinybird behind the scenes. Just imagine replacing all usages of "Vercel" with Tinybird.